Annual Reports
Whole Project 2019
David Wolfson, Minnesota Cooperative Fish and Wildlife Research Unit, Department of Fisheries, Wildlife, and Conservation Biology, University of Minnesota, St. Paul, Minnesota, USA.
David E. Andersen, U.S. Geological Survey, Minnesota Cooperative Fish and Wildlife Research Unit, 200 Hodson Hall, 1980 Folwell Ave, St. Paul, Minnesota, USA.
John Fieberg, Department of Fisheries, Wildlife, and Conservation Biology, University of Minnesota, St. Paul, Minnesota, USA.
Abstract: The Interior Population (IP) of trumpeter swans (Cygnus buccinator) was established through extensive re-introductions beginning in the late 1960s throughout the Upper Midwest. To date, the primary conservation objective for IP trumpeter swans has been to re-establish breeding populations across their historical distribution. Since those early restoration efforts, the IP has far exceeded original population objectives and numbered 27,055 in the latest (2015) North American Swan Survey. Annual population growth rate estimates since 2000 (based on the number of swans observed on annual waterfowl surveys in Minnesota) are ~1.20. Across much of their current breeding distribution, IP trumpeter swans have transitioned from a rare to a common component of the regional waterfowl community. However, unlike many other waterfowl species, very little is known about the ecology of IP trumpeter swans, including movement ecology and habitat use at multiple spatial scales. Beginning in 2019, we began addressing some of these information needs through a collaborative project to deploy GPS-GSM transmitters on trumpeter swans distributed across the IP. In 2019, we deployed 19 transmitters on IP trumpeter swans (7 in Minnesota and 12 in Michigan) and have since monitored their movements remotely.
Introduction
Interior Population (IP) trumpeter swans have high intrinsic and economic value as a protected wildlife species. For example, Minnesota citizens enthusiastically invested in the restoration of trumpeter swans through the check off donation and other funding sources to the Minnesota Department of Natural Resources (MNDNR) Nongame Program since the mid-1980s. The Interior Population of trumpeter swans has increased dramatically since they were re-established beginning in the 1960s and 1970s and both population size and distribution have expanded significantly. Trumpeter swans in Minnesota are an example of such increases, with an original reintroduction goal of 15 breeding pairs and a revised interim goal of 500 individuals by 2001 (Fig 1). The Minnesota population was estimated at > 17,000 in the most recent North American survey in 2015 (Groves 2017), and estimates of population growth rate based on trumpeter swans observed on annual Minnesota waterfowl surveys is ~1.20 since 2000 (Minnesota Department of Natural Resources, unpublished data).
Trumpeter swans currently breed throughout most of the western Great Lakes region, including in Minnesota, Wisconsin, Michigan, Iowa, Manitoba, Ontario, and Ohio. However, beyond estimates of population size and trend and distribution, there is relatively little recent information about their ecology, hindering conservation decision-making. To address current information needs, we initiated a project in 2019 to mark a sample of Interior Population trumpeter swans with GPS-GSM transmitters. These transmitters record high-resolution, high frequency location and related data and transmit those data through cellular phone networks, and will allow us to:
- Evaluate year-round swan movements, including determining the locations where swans spend the winter, and the timing and duration of their movements.
- Determine whether and where trumpeter swans make molt migrations.
- Evaluate year-round habitat use and selection patterns of trumpeter swans.
- Estimate annual survival rates of trumpeter swans, if sample sizes are adequate and fates (i.e., mortality events) can be determined.
Results of this study will inform current and future IP trumpeter swan conservation by providing basic information about migration, year-round movements, mortality risks, and use of agricultural and other landscapes. As part of this project, location data will be archived and made available to the public via a website (https://trumpeterswan.netlify.com/locations.html) (Fig 2) that summarizes trumpeter swan movements and habitat use. Thus, the project will also offer the opportunity to actively engage and inform the general public about how their past investment in conservation made a positive difference to the region’s natural heritage today.
Study Area
Our study area is defined by the current distribution of IP trumpeter swans (Groves 2017). In 2019, we trapped and deployed transmitters on IP trumpeter swans in Minnesota and project collaborators captured swans in Michigan. Capture locations in Minnesota ranged from as far south as the west metropolitan area of the Twin Cities (45.0° N, 93.6° W) to as far north as Thief Lake (48.5° N, 95.9° W). Capture locations in Michigan spanned from southwestern Michigan (42.3° N, 85.3° W) to Seney National Wildlife Refuge in the Upper Peninsula (46.3° N, 85.9° W). Capture locations in Minnesota occurred in a mix of Laurentian Mixed Forest and Eastern Broadleaf Forest, and Aspen Parklands in the most northern portion of the study area (Cleland et al. 1997). Capture locations in Michigan occurred in Laurentian Mixed Forest.
Methods
Swan capture: We captured swans during the Definitive Prebasic Molt period when adults are flightless. In Minnesota during 2019, we used a variety of watercraft to evaluate the efficacy of different capture methods; these included airboats, jon-boats, and square-stern canoes with either an outboard or long-tail mud motor. We hand-captured swans using a shepherd’s crook pole. Collaborators captured swans in Michigan using a step deck transom boat with a surface drive motor and a shoulder-mounted netlauncher (CODA Enterprises, Mesa, Arizona, USA). All capture and handling methods were approved by the University of Minnesota Institutional Animal Care and Use Committee (Protocol #1905-37072A)
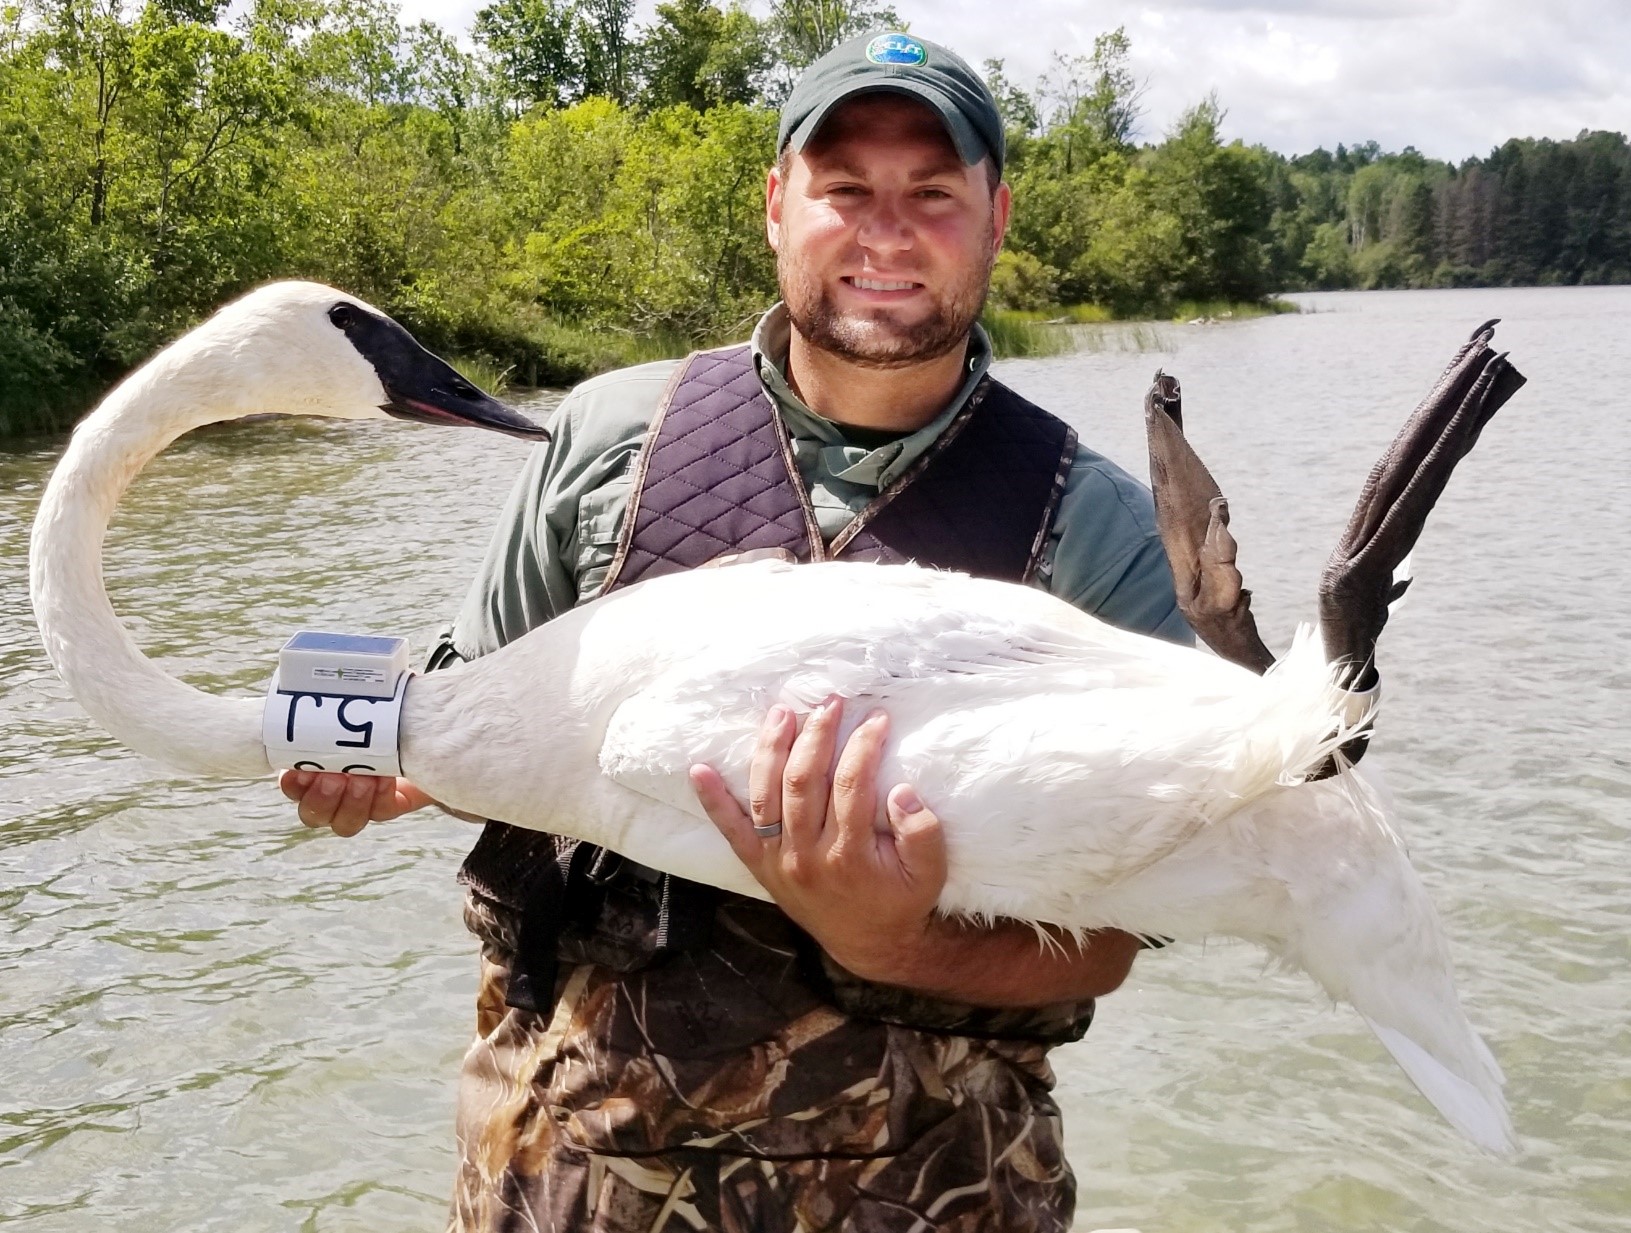
We marked swans in Minnesota with 55-g neck collars with GPS-GSM transmitter incorporated into the collar housing (Model OrniTrack-N62 3G, Ornitela, Vilnius, Lithuania; see Fig 3). Collaborators marked swans in Michigan with 140-g GPS transmitters (Model CTT-ES400, Cellular Tracking Technologies, Rio Grande, New Jersey, USA) that were adhered to 64-mm neck collars (Haggie Engraving, Crumpton, Maryland, USA; see Fig 4). All swans marked in 2020 will be fitted with Ornitela collars. Neck collars for all swans in this study also had a unique 2-character, alpha-numeric code (black characters on a white background). We took feather samples from all captured swans in 2019 for potential genetic and/or isotopic analyses.
Data: Transmitters are programmed to collect GPS locations at 15-min intervals throughout the 24-hr daily period. Locations are stored on-board in internal transmitter memory. Once a day, the transmitters attempt to upload the entire batch of locations to the Ornitela back-end database via a cellular network using a General Packet Radio Service (GPRS) connection if available, or a Global System for Mobile Communication (GSM) connection if GPRS is not available. GPRS is a more efficient and upgraded transmission option than GSM. Cellular Tracking Technologies (CTT) transmitters attempt to upload once a day to the CTT back-end database using a GSM connection. All new locations from both companies’ databases are uploaded daily to a data repository at Movebank for archiving and future processing.
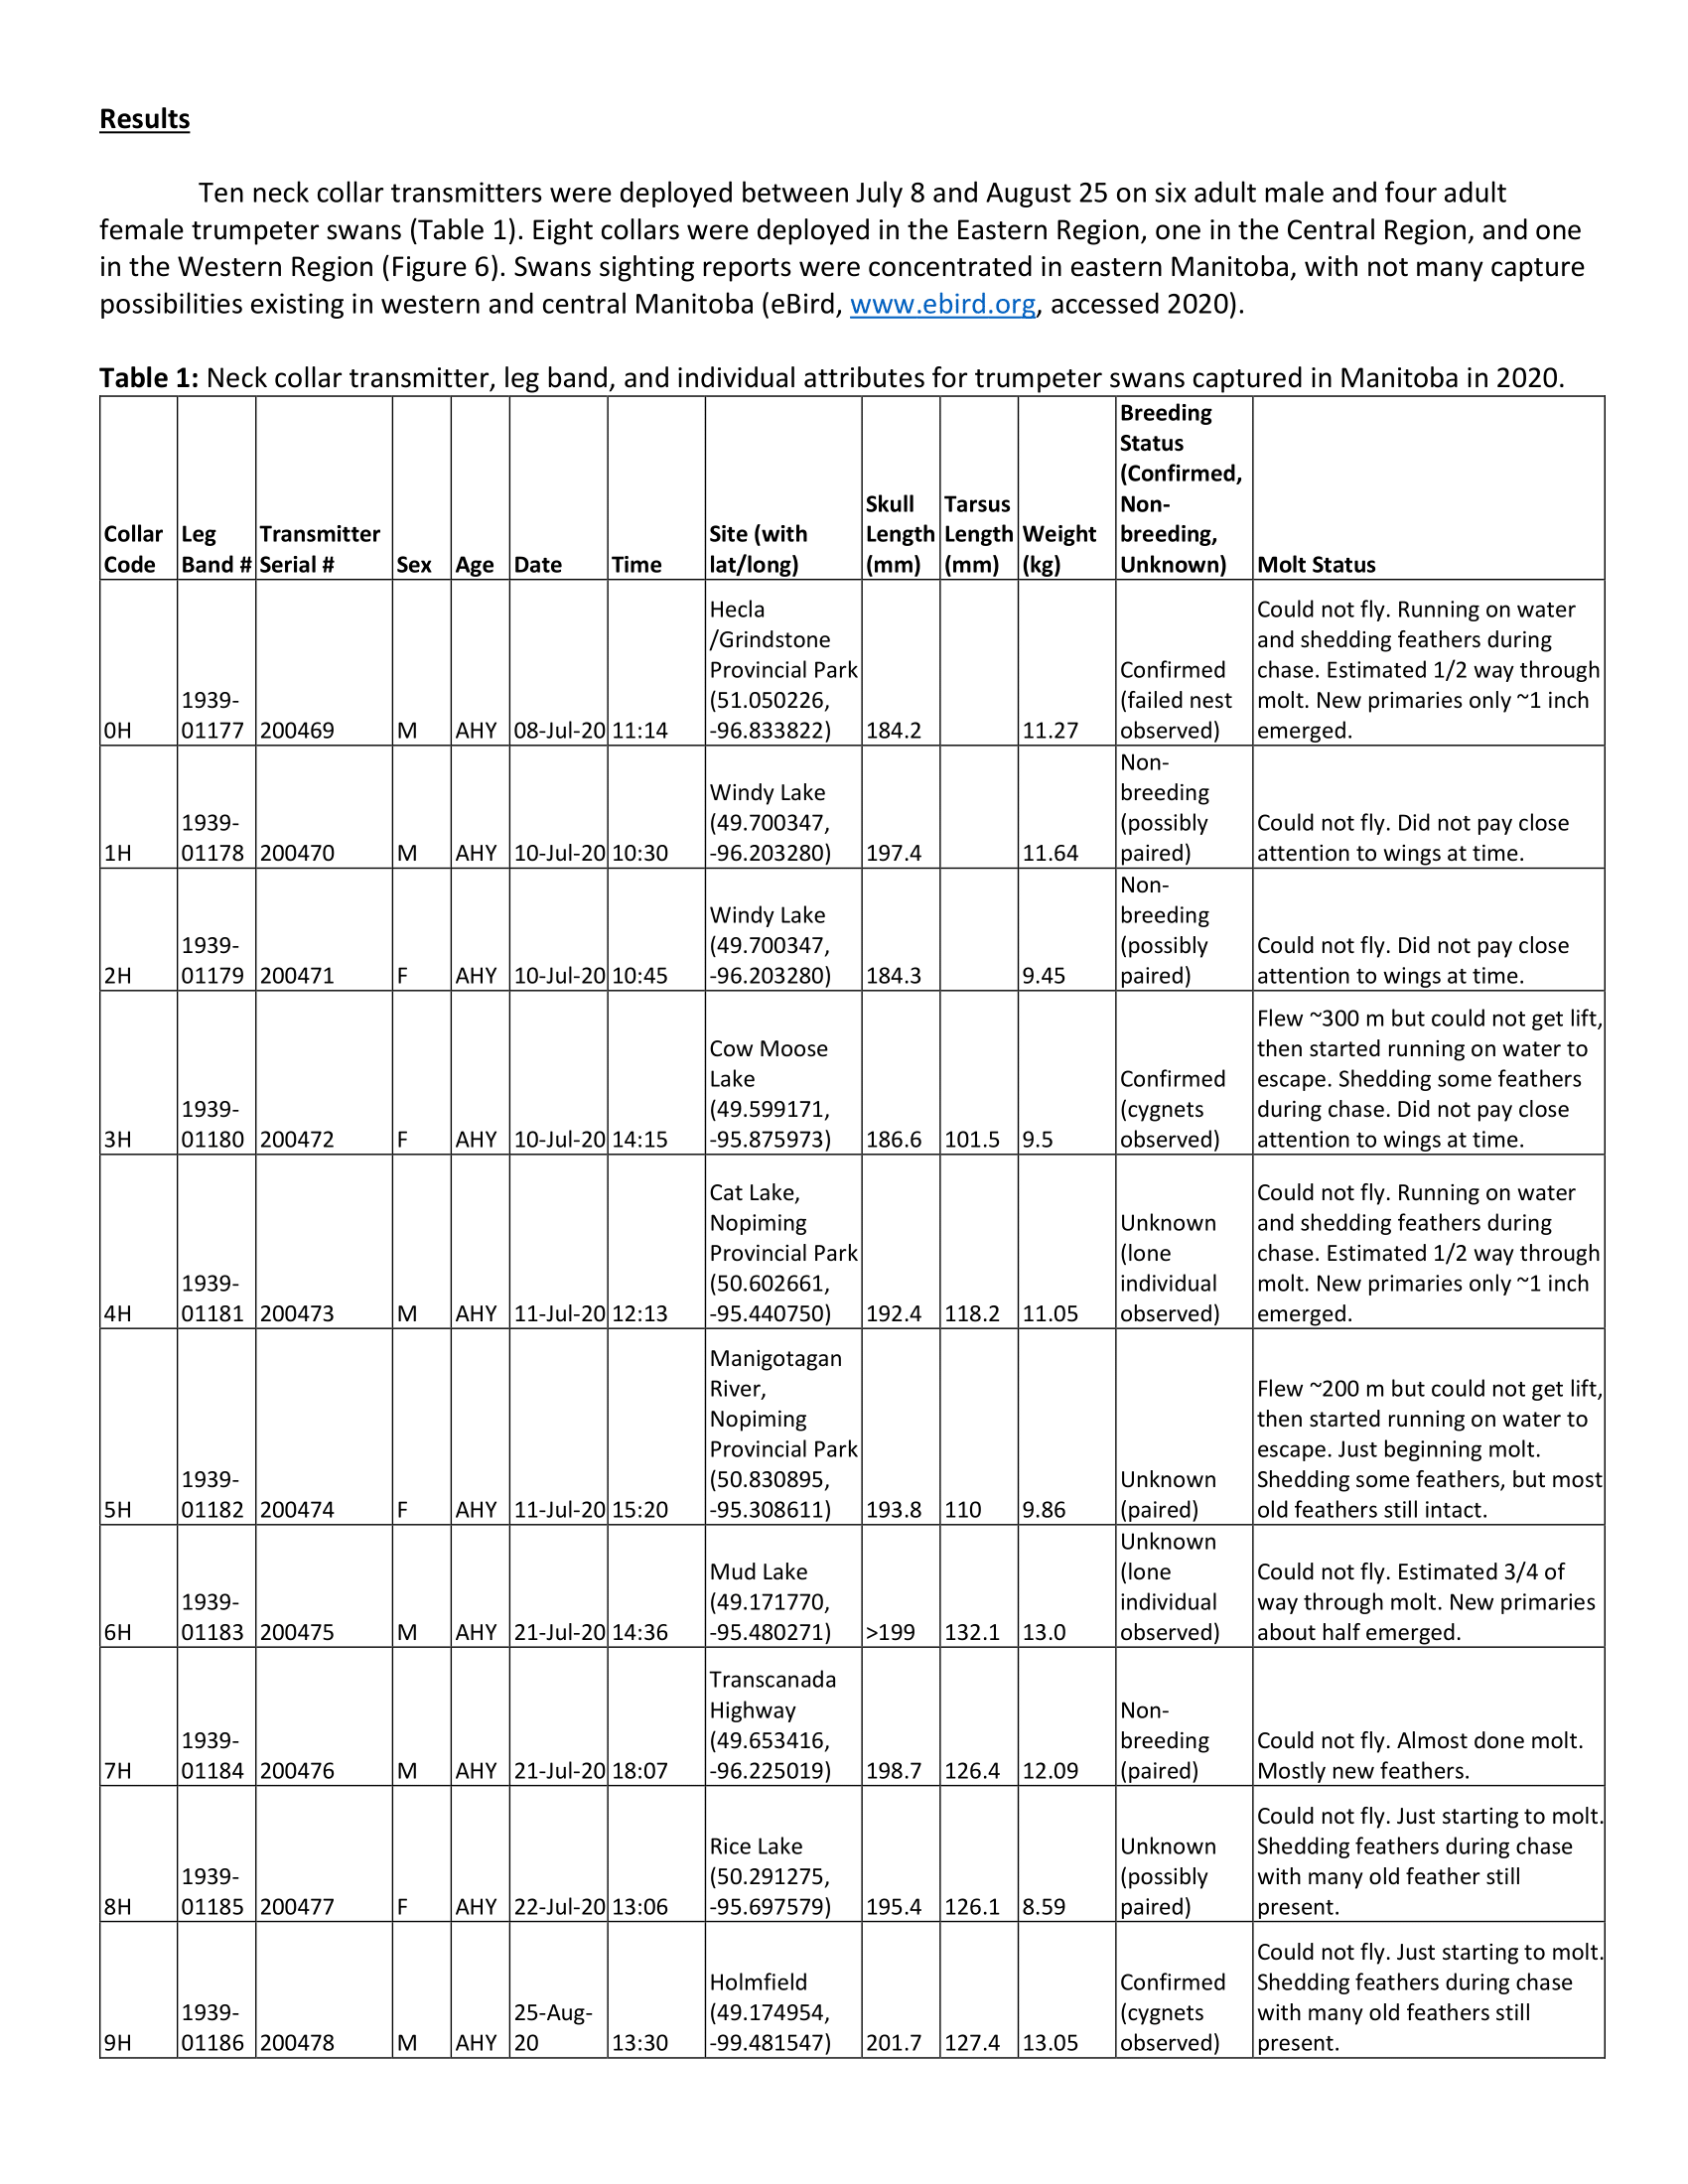
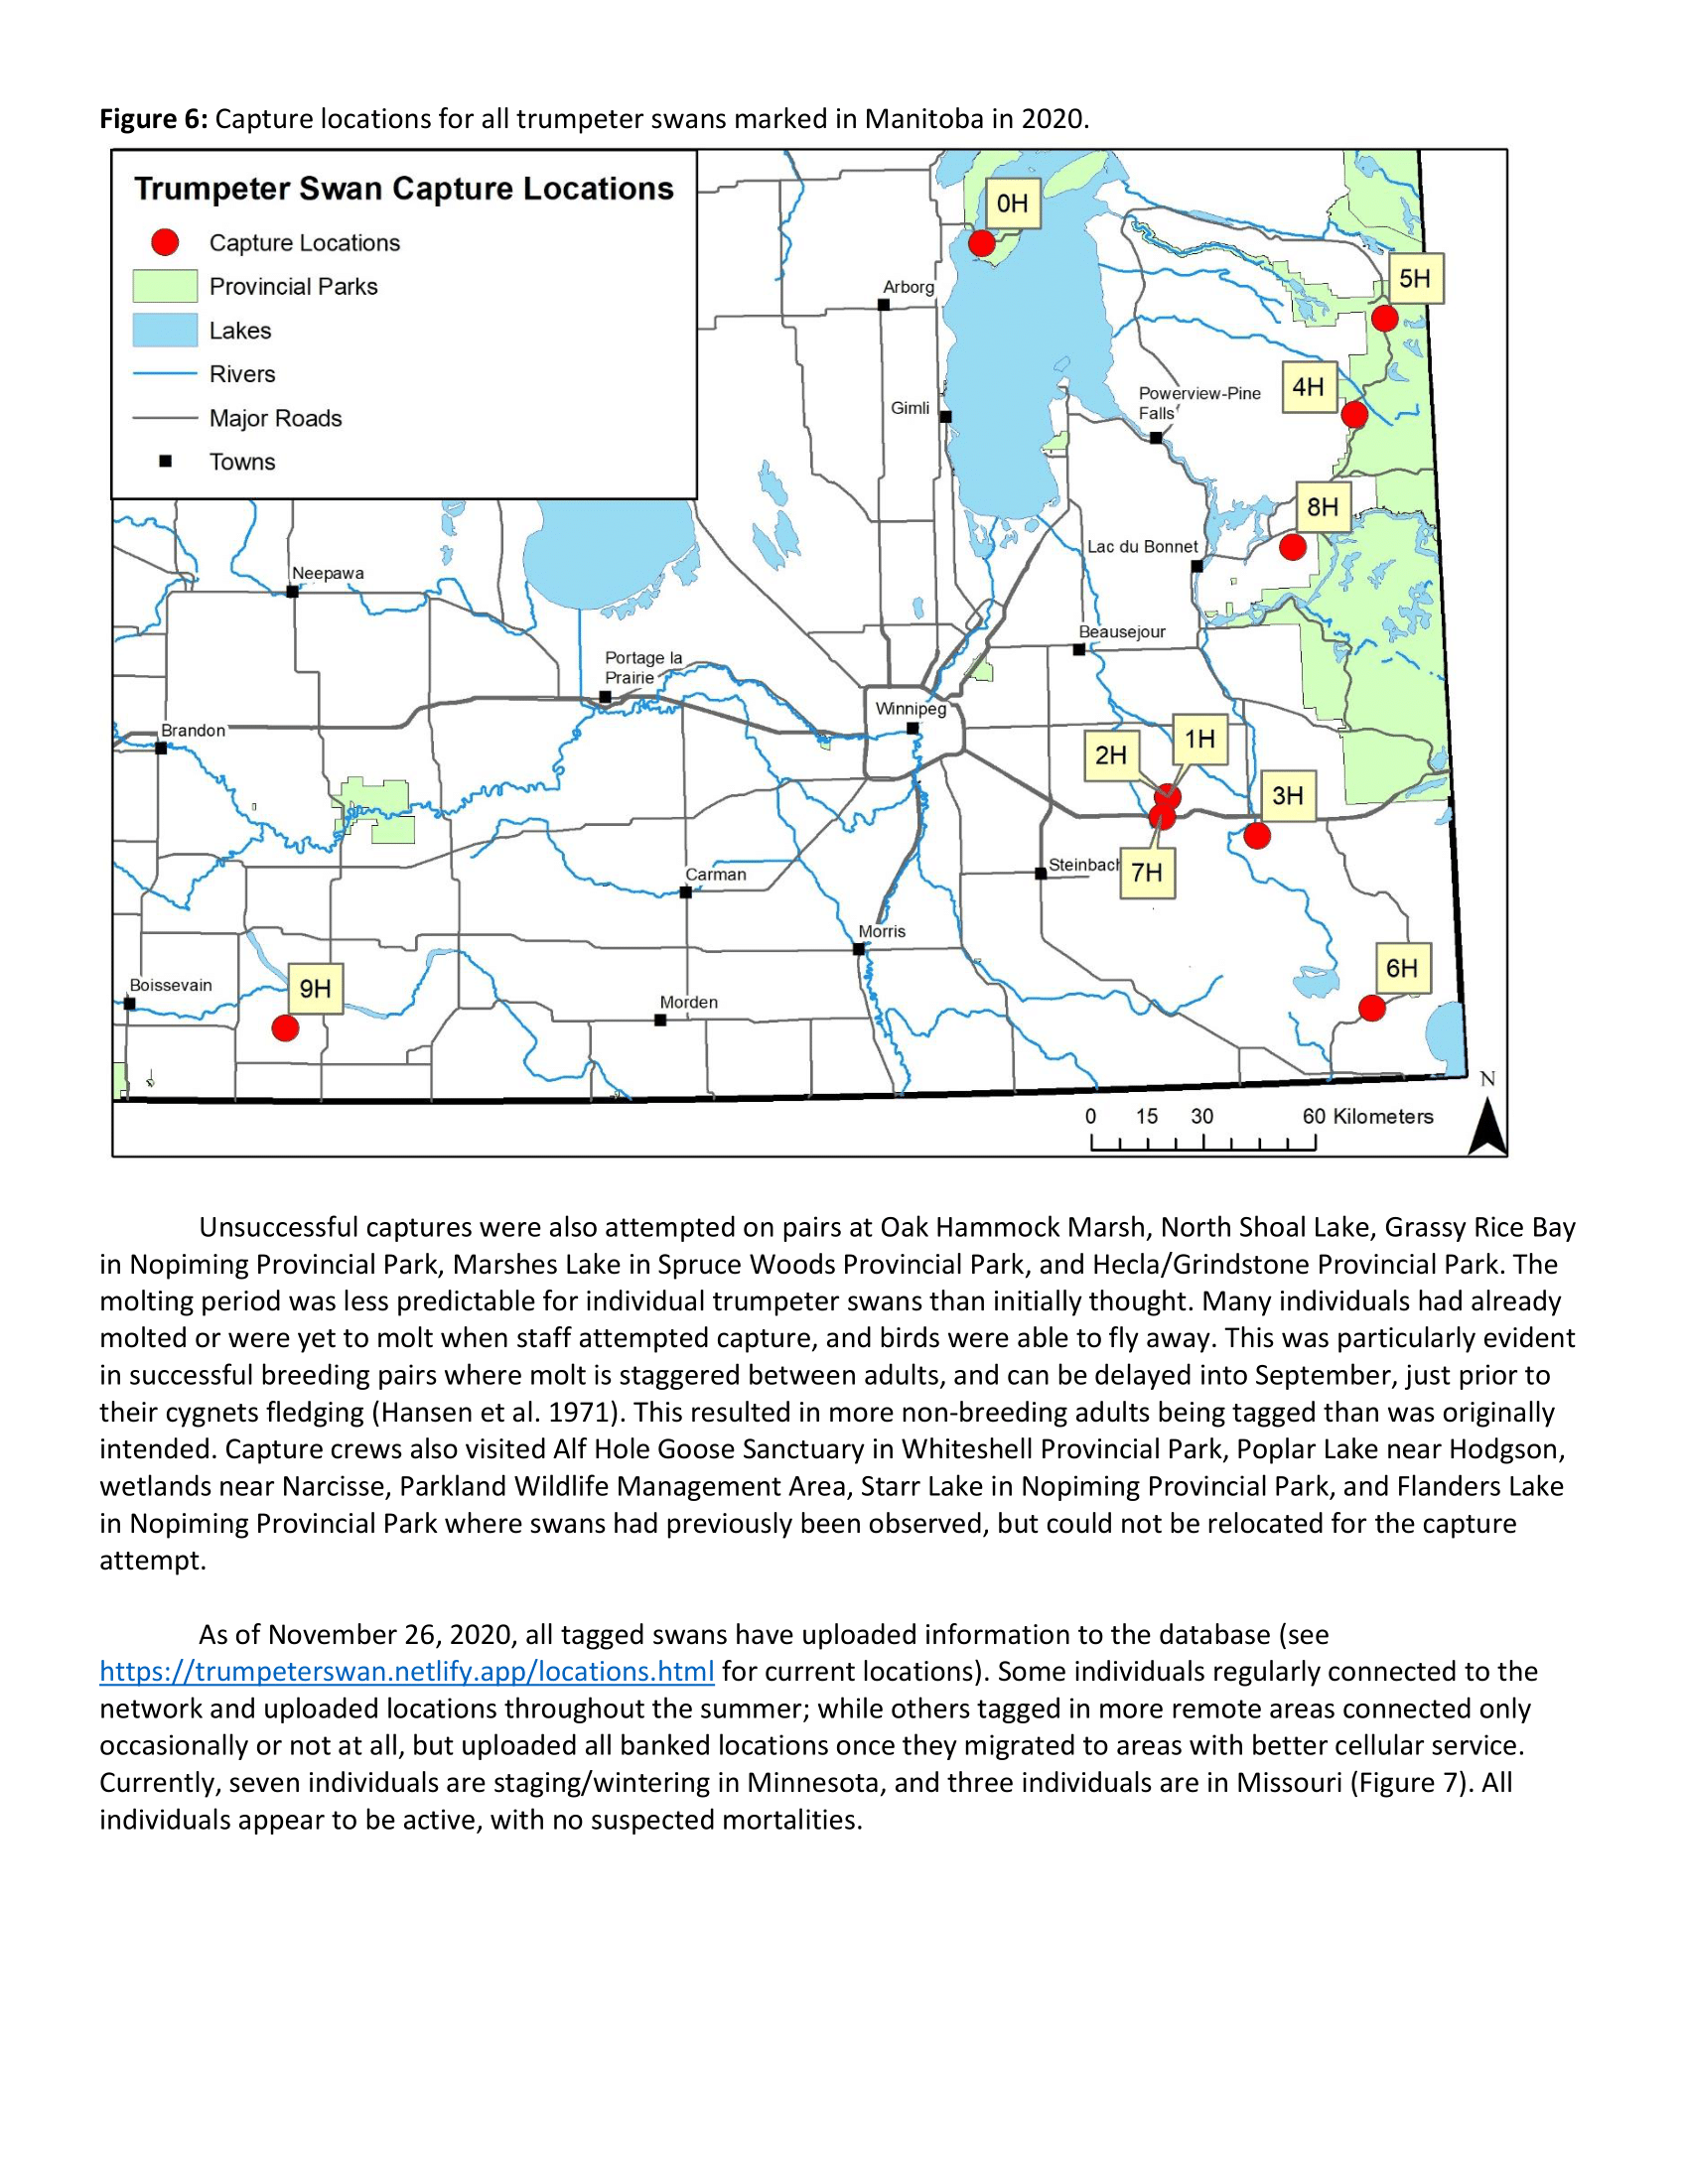
Results
We deployed 19 transmitters in Minnesota (n = 7) and Michigan (n = 12) during the summer of 2019. One marked swan in Michigan died as a result of a powerline strike but we recovered the transmitter and plan to re-deploy it in summer 2020.
Swans marked during summer 2019 stayed near their breeding territories between the date of capture (July-September) and October. Once temperatures dropped in November, most marked swans in Minnesota left their territories and flew south, although there was considerable variation in the timing of these departures. The earliest longer-distance movements from capture locations (> 100 km) were by swans in the most northern section of the study area. Some swans exhibited a direct flight path to where they settled for the winter whereas others moved shorter distances and lingered in what appear to be stop-over areas for several weeks. Most swans (5 of 7) captured in Minnesota traveled > 100 km from their capture site but only 2 swans in Michigan made movements > 100 km and most are still in the vicinity of their summer territory. Swans appear to be predominantly overwintering on major rivers, likely related to the presence of open (i.e., not frozen) water during the winter.
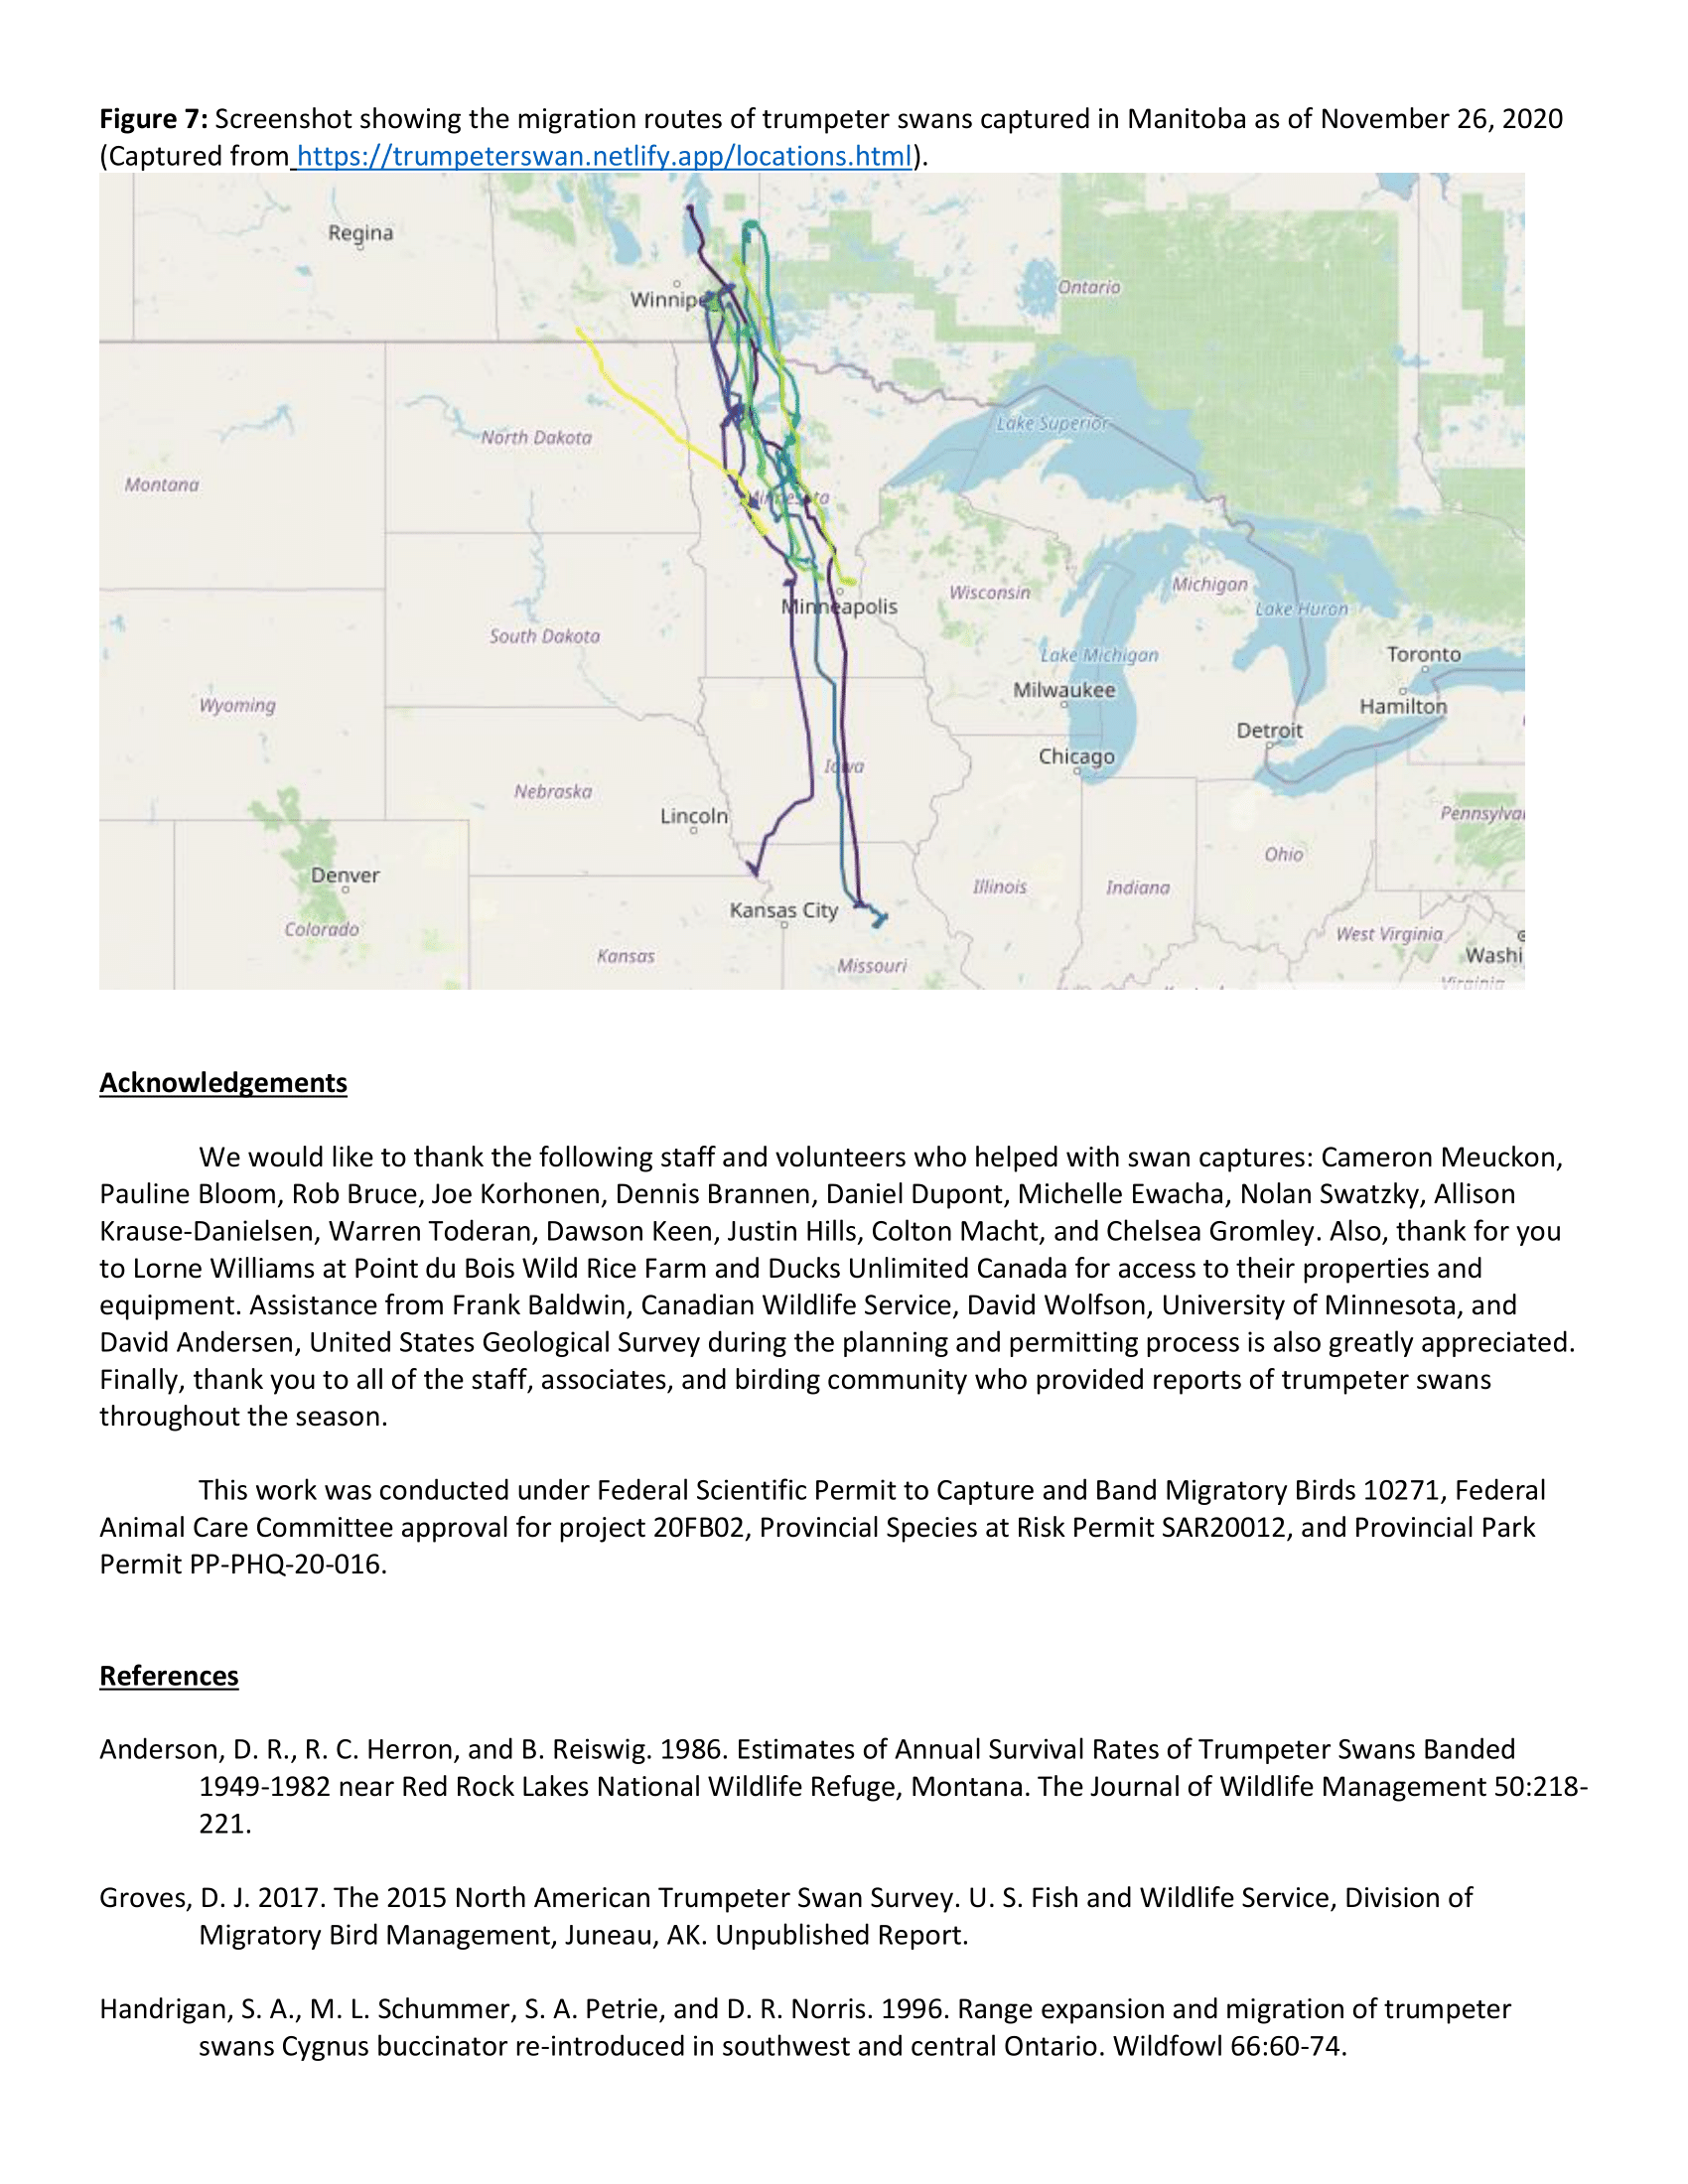
Project outreach: From August 2019-February 2020, we presented project overviews to a variety of stakeholders at the Mississippi Flyway Council Technical Meeting in Duluth, Minnesota; the 25th Trumpeter Swan Society Meeting in Alton, Illinois; the 80th Midwest Fish and Wildlife Conference in Springfield, Illinois; the Northwest Minnesota, Minnesota Department of Natural Resources Managers Meeting in Norris Camp, Minnesota; and the Annual Meeting of the Minnesota Chapter of The Wildlife Society in Willmar, Minnesota. To facilitate public engagement with project objectives and ongoing results we created a project website (https://trumpeterswan.netlify.com). During the fall and winter of 2019, we added 3 state natural resources agencies (Iowa, Wisconsin, and Ohio), 1 provincial Canadian government agency (Manitoba/Canadian Wildlife Service), and 1 tribal agency (Great Lakes Indian Fish and Wildlife Commission) as collaborators to increase the geographical scope of our project. As the project develops, we will continue to reach out to individuals that can provide relevant expertise and who may be in a position to further expand the scope of our project (see Appendix I for a list of project collaborators).
Future Plans
Swan capture will take place in 2020 once adult swans begin Prebasic Molt on their breeding territories. We plan to deploy ~75 additional transmitters spread throughout the IP breeding range during the summer of 2020. Approximately 30 transmitters will be deployed in Minnesota and the remainder will be distributed among the other states and province. We are also working with the Trumpeter Swan Society to deploy transmitters on wintering trumpeter swans in Arkansas during winter 2020-2021.
We anticipate that data from deployed collars will continue to be received until the end of the project in 2023. Starting in 2020 we plan to also collect blood samples for potential genetic and ecotoxicology analyses.
Literature Cited
Cleland, D. T., P. E. Avers, W. H. McNab, M. E. Jensen, R. G. Bailey, T. King, and W. E. Russell. 1997. National hierarchical framework of ecological units. Pages 181-200 in Boyce, M. S. and A. Haney, editors. Ecological management application for sustainable forest and wildlife resources. Yale University Press, New Haven, Connecticut, USA.
Groves, D. J. 2017. The 2015 North American Trumpeter Swan Survey. Unpublished report, U. S. Fish and Wildlife Service, Division of Migratory Bird Management, Juneau, Alaska, USA.
Figure 1. Minnesota trumpeter swan population size estimated from waterfowl surveys conducted over approximately 39% of the area of the state (MN DNR, unpublished data). The trumpeter swan population in Minnesota has increased substantially, dramatically exceeding original and interim population goals, and is currently growing at an annual rate of ~1.20.
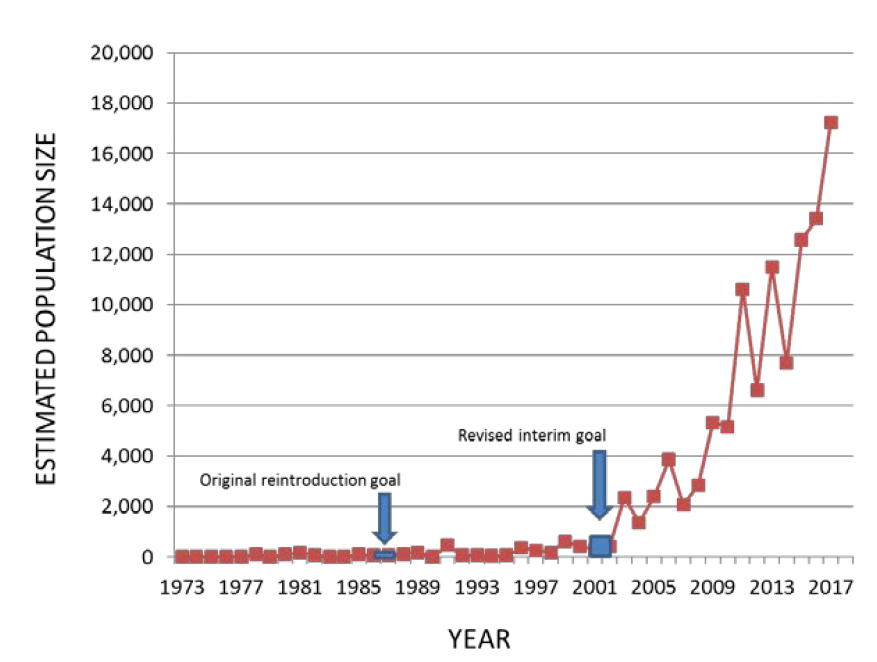
Figure 2 Locations of all marked swans are regularly uploaded to a project website that allows users to interactively visualize swan movements. Capture and end locations are represented by colored points. Lines connecting these points show individual movement trajectories observed thus far.
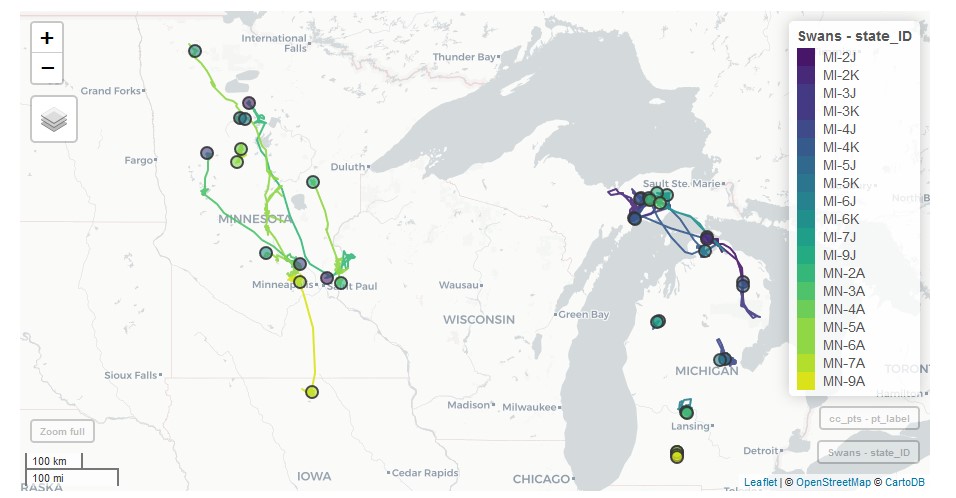
Figure 3 An example of the Ornitela OrniTrack-N62 collars with GPS-GSM transmitter incorporated into the internal housing that were deployed in Minnesota during 2019. All new deployments in 2020 will be this design.
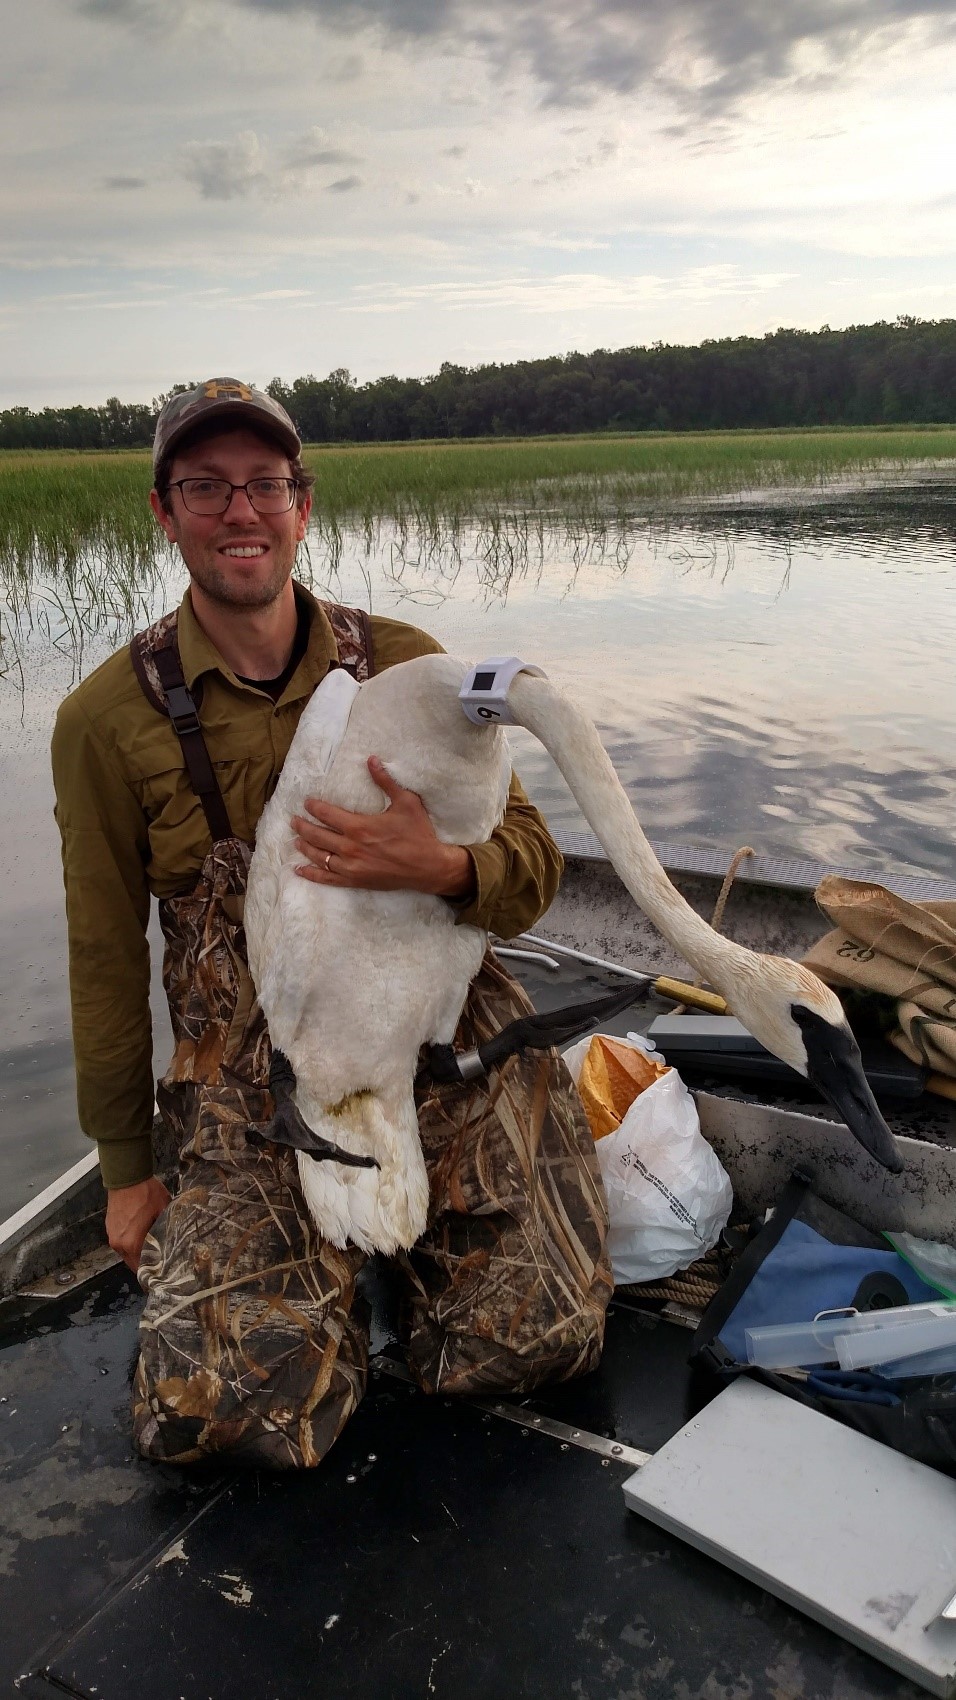
Figure 4 An example of the Cellular Tracking Technology CTT-ES400 model transmitters affixed to neck collars that were deployed on trumpeter swans in Michigan during 2019.
Whole Project 2020
David Wolfson, Minnesota Cooperative Fish and Wildlife Research Unit, Department of Fisheries, Wildlife, and Conservation Biology, University of Minnesota, St. Paul, Minnesota, USA.
David E. Andersen, U.S. Geological Survey, Minnesota Cooperative Fish and Wildlife Research Unit, 200 Hodson Hall, 1980 Folwell Ave, St. Paul, Minnesota, USA.
John Fieberg, Department of Fisheries, Wildlife, and Conservation Biology, University of Minnesota, St. Paul, Minnesota, USA.
Abstract: The Interior Population (IP) of trumpeter swans (Cygnus buccinator) was established through extensive re-introductions beginning in the late 1960s throughout the Upper Midwest. Across much of their current breeding distribution, IP trumpeter swans have transitioned from a rare to a common component of the regional waterfowl community. However, unlike many other waterfowl species, very little is known about the ecology of IP trumpeter swans, including movement ecology and habitat use at multiple spatial scales. Beginning in 2019, we began addressing some of these information needs through a collaborative project to deploy GPS-GSM transmitters on trumpeter swans distributed across the IP. In 2019, we deployed 19 transmitters on IP trumpeter swans (7 in Minnesota and 12 in Michigan). In 2020, we deployed an additional 77 transmitters on IP trumpeter swans (10 in Manitoba, 40 in Minnesota, 9 in Iowa, 5 in Wisconsin, 1 in Michigan, 12 in Ohio). Movements of marked swans have been highly variable across the IP breeding range, with swans that breed at higher latitudes more likely to migrate and travel longer distances during the winter.
Introduction
Interior Population (IP) trumpeter swans have high intrinsic and economic value as a protected wildlife species. For example, Minnesota citizens enthusiastically invested in the restoration of trumpeter swans through the check off donation program and other funding sources supporting the Minnesota Department of Natural Resources (MNDNR) Nongame Program since the mid-1980s. Since they were re-established beginning in the 1960s and 1970s, IP trumpeter swans have increased dramatically in population size and expanded their distribution significantly. Trumpeter swans in Minnesota are an example of such increases, with an original reintroduction goal of 15 breeding pairs and a revised interim goal of 500 individuals by 2001 (Fig. 1). The Minnesota population was estimated at > 17,000 individuals in the most recent North American survey in 2015 (Groves 2017). We estimated an annual finite population growth rate of ~1.20 using observations of trumpeter swans during annual Minnesota waterfowl surveys from 2000-2017 (Minnesota Department of Natural Resources, unpublished data).
Trumpeter swans currently breed throughout most of the western Great Lakes region, including in Minnesota, Wisconsin, Michigan, Iowa, Manitoba, Ontario, and Ohio. However, beyond estimates of population size and trend and breeding distribution, there is relatively little recent information about their ecology, therefore hindering conservation decision-making. To address current information needs, we initiated a project in 2019 to mark and follow a sample of IP trumpeter swans with GPS-GSM transmitters for multiple years. These transmitters record high-resolution, high frequency location and related data and transmit those data through cellular phone networks, and will allow us to:
- Evaluate year-round swan movements, including determining the locations where swans spend the winter and the timing and duration of their movements.
- Determine whether and where trumpeter swans make molt migrations.
- Evaluate year-round habitat use and selection patterns of trumpeter swans.
- Estimate annual survival rates of trumpeter swans, if sample sizes are adequate and fates (i.e., mortality events) can be determined.
Results of this study will inform current and future IP trumpeter swan conservation by providing basic information about migration, year-round movements, mortality risks, and use of agricultural and other landscapes. As part of this project, location data will be archived and made available to the public via a website (https://trumpeterswan.netlify.com/locations.html; Fig. 2) that summarizes trumpeter swan movements and habitat use. Thus, the project will also offer the opportunity to actively engage and inform the public about how their past investment in conservation made a positive difference to the region’s natural heritage today.
Since inception of the original project centered in Minnesota (where the bulk of IP trumpeter swans breed), additional funding and collaborations with additional project partners have allowed us to expand the scope of the project to include the following research objectives:
- Quantify the extent of gene flow among IP trumpeter swans, their overall genetic diversity, and genetic differentiation from source populations.
- Evaluate the association between migratory behavior and genetic divergence of different groups of trumpeter swans.
- Quantify concentrations of lead in IP trumpeter swans and assess potential sub-lethal effects of lead exposure on migration and annual movements.
In addition to Minnesota, other states and provinces that are also marking trumpeter swans as part of the larger study include Michigan, Iowa, Wisconsin, Ohio, and Manitoba. State biologists from the Nebraska Game and Parks Commission are also contributing blood samples from the High Plains flock of IP trumpeter swans to include in the genetic analyses.
Study Area
Our study area is defined by the current distribution of IP trumpeter swans (Groves 2017). We deployed transmitters on IP trumpeter swans as far north and west as southern Manitoba (51.1° N, 99.7° W) and as far south and east as central Ohio (40.6° N, 82.7° W). Capture locations occurred in a mix of Laurentian Mixed Forest, Prairie Parkland, Eastern Broadleaf Forest, and Aspen Parklands (Cleland et al. 1997).
Methods
Swan capture: We captured swans during the definitive prebasic molt period when adults are flightless. In Minnesota during 2019, we used a variety of watercraft to evaluate the efficacy of different capture methods; these included airboats, kayaks, and square-stern canoes with either an outboard or long-tail mud motor. We hand-captured swans using a shepherd’s crook pole. Collaborators captured swans in Michigan using a step deck transom boat with a surface drive motor and a shoulder-mounted netlauncher (CODA Enterprises, Mesa, Arizona, USA).
In Minnesota during 2020, we partnered with staff from the Minnesota DNR and Three Rivers Park District to locate and capture trumpeter swans throughout Minnesota using a flat-bottom jon boat with a lightweight 6.5 horsepower mud motor (Powell Performance Fab, Hutchinson, Minnesota, USA). We implemented COVID-19 safety protocols throughout the summer, which necessitated single-occupancy vehicles, reduced numbers of field staff, social distancing, and use of personal protective equipment. COVID-19 safety protocols also limited our ability to work in close physical proximity with project collaborators, and we therefore captured most swans with a 2-person field crew.
Protocols for capturing and marking trumpeter swans in U.S. states have been approved by the University of Minnesota Animal Care and Use Committee (protocol no. 1905-37072A), the Minnesota Department of Natural Resources (Special Permit no. 19017), the Michigan Department of Natural Resources (Threatened and Endangered Species Permit TE 175), the U.S. Fish and Wildlife Service (Research & Monitoring Special Use Permit no. K-10-001), and the U.S. Geological Survey Bird Banding Laboratory (Federal Bird Banding Permit no. 21631). All capture and marking of trumpeters swans in Manitoba was conducted under Federal Scientific Permit to Capture and Band Migratory Birds (no. 10271), Federal Animal Care Committee approval (project 20FB02), Provincial Species at Risk Permit (no. SAR20012), and Provincial Park Permit (no. PP-PHQ-20-016).
We marked swans in Minnesota with 55-g neck collars with GPS-GSM transmitter incorporated into the collar housing (Model OrniTrack-N62 3G, Ornitela, Vilnius, Lithuania; see Fig. 3). Collaborators marked swans in Michigan with 140-g GPS transmitters (Model CTT-ES400, Cellular Tracking Technologies, Rio Grande, New Jersey, USA) that were adhered to 64-mm neck collars (Haggie Engraving, Crumpton, Maryland, USA; see Fig. 4). All swans marked in 2020 (except a transmitter redeployed in Michigan recovered from a mortality in 2019, see below) were fitted with Ornitela collars. Neck collars for all swans in this study also had a unique 2-character, alpha-numeric code (black characters on a white background). We took feather samples from all captured swans in 2019 and blood samples from all captured swans in 2020 for genetic analyses and testing for lead concentrations. We clipped the calamus from collected feathers and stored them in 2mL cryotubes with 95% ethanol solution. We used a 23-gauge, 1 inch needle and a 3mL syringe to extract 2mL of blood. Approximately 0.1mL of blood was deposited on a Whatman FTA card (Sigma-Aldrich, St. Louis, Missouri, USA). We collected the rest of the blood sample in a 2mL tube containing ethylenediaminetetraacetic acid (EDTA) and refrigerated all tubes until they were received at the diagnostic lab.
During the winter of 2019—2020, 8 of the deployed GPS-GSM collars failed due to extreme temperatures and/or water penetration. To address this issue, we worked with the manufacturer during the off-season to amend the collar design for the next generation of collars we deployed in 2020. We replaced the lightweight foam insulation within the collar housing with a high-density epoxy that is more weather-resistant and have had no more apparent failures due to weather conditions at the time of this report.
Data: Transmitters are programmed to collect GPS locations at 15-min intervals throughout the 24-hr daily period. Locations are stored on-board in internal transmitter memory. Once per day, the transmitters attempt to upload the entire batch of stored locations to the Ornitela back-end database via a cellular network using a General Packet Radio Service (GPRS) connection if available, or a Global System for Mobile Communication (GSM) connection if GPRS is not available. GPRS is a more efficient and upgraded transmission option than GSM. Cellular Tracking Technologies (CTT) transmitters attempt to upload once a day to the CTT back-end database using a GSM connection. If an upload attempt fails, location data are stored on-board the transmitter until a successful connection can be made. All new locations from both companies’ databases are uploaded daily to a data repository at Movebank for archiving and future processing.
Analysis of lead concentrations: We analyzed blood lead concentrations using inductively coupled plasma mass spectrometry at the Veterinary Diagnostic Laboratory of Iowa State University. We measured the concentration of lead in parts per billion (ppb) from whole blood samples preserved with EDTA.
To explore the sub-lethal effects of lead, we used quantile regression to test the relationship between swan blood lead concentration and distance traveled from the capture site to the furthest point south during the winter. We used quantile regression to estimate the conditional median of the response variable as opposed to least squares estimation because it relaxes the assumption of equal variance among residuals and is more appropriate for skewed distributions (Cade and Noon 2003).
Results
We deployed 19 transmitters in Minnesota (n = 7) and Michigan (n = 12) during July-August 2019. One marked swan in Michigan died as a result of a powerline strike but we recovered the transmitter and re-deployed it in summer 2020. We deployed 40 GPS-GSM transmitters on trumpeter swans in Minnesota during June-September 2020. During the summer 2020 field season (June-September), partnering agencies captured and collared 38 trumpeter swans in Manitoba (n=10), Iowa (n=9), Wisconsin (n=5), Michigan (n=1) and Ohio (n=12).
Swans marked during summer 2019 stayed near their breeding territories between the date of capture (July-September) and October. Once temperatures dropped in November, most marked swans in Minnesota left their territories and flew south, although there was considerable variation in the timing of these departures. The earliest longer-distance movements from capture locations (> 100 km) were by swans in the most northern section of the study area. Some swans exhibited a direct flight path to where they settled for the winter whereas others moved shorter distances and lingered in what appear to be stop-over areas for several weeks. Most swans (5 of 7) captured in Minnesota traveled > 100 km from their capture site but only 2 swans in Michigan made movements > 100 km and most remained in the vicinity of their summer territory. Swans predominantly overwintered on major rivers, likely related to the presence of open (i.e., not frozen) water during the winter.
We have observed a large amount of variability this fall (2020) in the prevalence of long-distance migration (Fig. 5). Swans that bred at latitudes ≥ 48° N (n=13) all migrated long distances (\(\bar{x}\)= 767 km, s= 364 km, range = 262—1,330 km). Swans that bred in the middle latitudes of our study area, between 43° and 48° N (n=55), showed a variety of migration strategies, with some traveling over 1,250 km while others stayed within 5 km of their breeding territory (\(\bar{x}\)= 293 km, s= 349 km, range = 5—1,287 km). Swans that bred or were captured during the breeding season at southern latitudes, below 43° N (n = 15), all stayed within 22 km of their breeding territories (\(\bar{x}\)= 8 km, s= 6 km, range = 1—21 km).
Most swans overwintering north of 41° N latitude settled on major rivers, although 13 swans used either lakes with aerators or gravel quarries because they provide water bodies not completely covered with ice during winter (Fig. 6). Most swans that overwintered south of 41° N latitude used a variety of wetlands, lakes, and reservoirs that we presume are ice-free (Fig. 7).
There are currently 84 trumpeter swans with active GPS-GSM collars marked as part of this collaborative project, which upload ~7,000 locations each day to the back-end database. We have compiled ~1.5 million locations on the Movebank data repository.
We detected the presence of lead in all marked swans, though concentrations were low for almost all swans (\(\bar{x}\)=81 ppb, s=136 ppb, range = 4.3—1,076 ppb). We did not find a significant effect of blood lead concentrations on the distance traveled during autumn 2020 (Table 1).
Project outreach: From August 2019—February 2020, we presented project overviews to a variety of stakeholders at the Mississippi Flyway Council Technical Meeting in Duluth, Minnesota; the 25th Trumpeter Swan Society Meeting in Alton, Illinois; the 80th Midwest Fish and Wildlife Conference in Springfield, Illinois; the Northwest Minnesota, Minnesota Department of Natural Resources Managers Meeting in Norris Camp, Minnesota; and the Annual Meeting of the Minnesota Chapter of The Wildlife Society in Willmar, Minnesota. To facilitate public engagement with project objectives and ongoing results we created a project website (https://trumpeterswan.netlify.com).
From March 2020—February 2021, we gave project presentations at the 27th Annual Wildlife Society Conference (virtual), the 81th Midwest Fish and Wildlife Conference (virtual), and the Mississippi Flyway Council (virtual). The project was featured in 4 local television news segments, 7 newspaper articles, and the press releases of 4 state natural resource agencies. We also were interviewed in 3 different podcast series. Since adding an analytics-tracking feature to the project website on 10 September 2020, we tracked ~5,000 visitation sessions from ~3,000 unique users in 20 different countries.
Discussion
Our preliminary results suggest that IP trumpeter swans exhibit a variety of migration strategies. Individuals that breed in the northern part of the current distribution all made relatively long-distance autumn migrations. Autumn migration distances of swans breeding at mid-latitudes were variable, with some swans moving considerable distances, and some swans remaining near their breeding locations. Swans breeding at lower latitudes all remained relatively near their breeding locations. Monitoring swans for additional years will allow us to evaluate consistency of migration between years for individual swans, and whether variation in annual conditions (e.g., winter severity, access to open water during winter, etc.) are related to migration behavior. We are also starting genetic analyses to help determine whether genetic lineage is related to migration distance.
Although we detected lead in all swans we sampled, lead concentrations did not appear to be related to autumn migration distance. Most swans we sampled had blood lead concentrations below those considered to result in lethal or sub-lethal effects. The very high blood concentration we observed in a single swan is perplexing, and the fate of that swan will be of particular interest to monitor.
Future Plans
Partners plan to deploy 14 additional collars during summer 2021 and 3 collars in Arkansas during winter 2021—2022.
We are continuing to host a project website showing the full summary of movement data and other project information. We have started the process of annotating the location data with remote sensing environmental variables, to facilitate future movement and habitat-selection analyses.
We have secured funding for genetic analyses, and are working with
Dr. Sushma Reddy and the University of Minnesota Genomics Center to
conduct these analyses. Processing genetic samples will begin in early
2021.
Literature Cited
Cade, B. S., and B. R. Noon. 2003. A gentle introduction to quantile regression for ecologists. Frontiers in Ecology and the Environment, 1(8): 412-420.
Cleland, D. T., P. E. Avers, W. H. McNab, M. E. Jensen, R. G. Bailey, T. King, and W. E. Russell. 1997. National hierarchical framework of ecological units. Pages 181-200 in Boyce, M. S. and A. Haney, editors. Ecological management application for sustainable forest and wildlife resources. Yale University Press, New Haven, Connecticut, USA.
Groves, D. J. 2017. The 2015 North American Trumpeter Swan Survey. Unpublished report, U. S. Fish and Wildlife Service, Division of Migratory Bird Management, Juneau, Alaska, USA.
Figure 1. Minnesota trumpeter swan population size estimated from waterfowl surveys conducted over approximately 39% of the area of the state (MN DNR, unpublished data). The trumpeter swan population in Minnesota has increased substantially, dramatically exceeding original and interim population goals, and is currently growing at an annual rate of ~1.20. The current (2020) spring population estimate is near 30,000.
Figure 2. Locations of all marked swans are regularly uploaded to a project website that allows users to interactively visualize swan movements. Capture and end locations are represented by colored points. Lines connecting these points show individual movement trajectories observed thus far. This figure represents swan captures in Minnesota and Michigan in 2019.
Figure 3. An example of the Ornitela OrniTrack-N62 collars with GPS-GSM transmitter incorporated into the internal housing that were deployed in Minnesota during 2019. All new deployments in 2020 were this design, with a modification to minimize failures experienced in 2019 that were likely the result of water entering the transmitter housing.
Figure 4. An example of the Cellular Tracking Technology CTT-ES400 model transmitters affixed to neck collars that were deployed on trumpeter swans in Michigan during 2019.
Figure 5. Distances traveled by marked swans from capture location to the farthest point south during 2020.
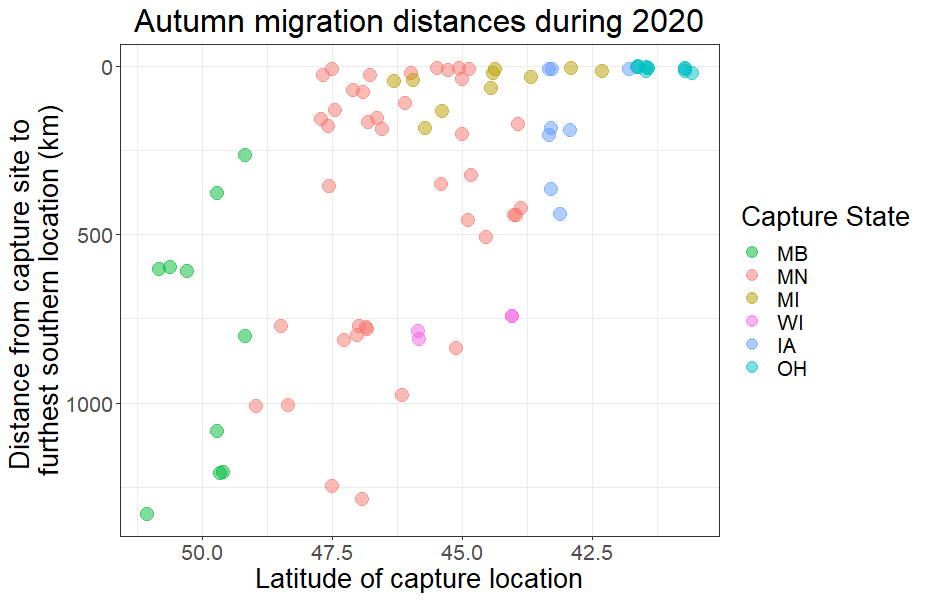
Figure 6. Overwintering locations of marked swans (through Dec 2020) and whether they settled on rivers, artificial open water (lakes with aerators, quarries, or gravel ponds), or naturally open water (wetlands and lakes without ice).
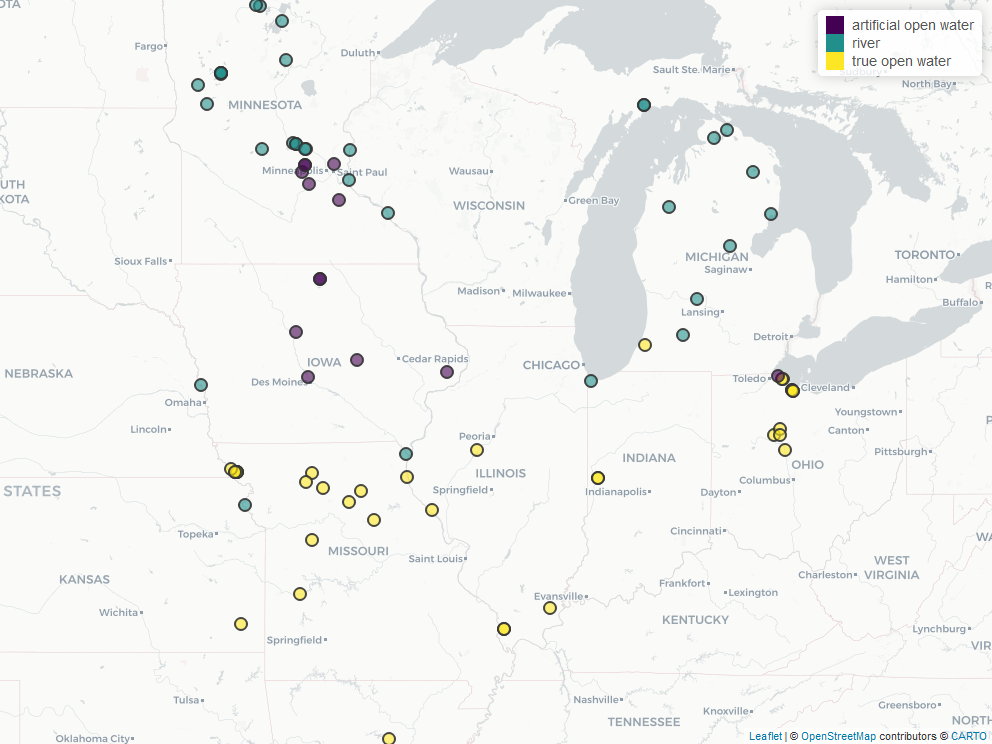
Figure 7 Flowchart showing the proportions of marked swans from each capture state that moved to each state to overwinter (through Dec 2020) and whether they settled on rivers, artificial open water (lakes with aerators, quarries, or gravel ponds), or naturally open water (wetlands and lakes without ice).
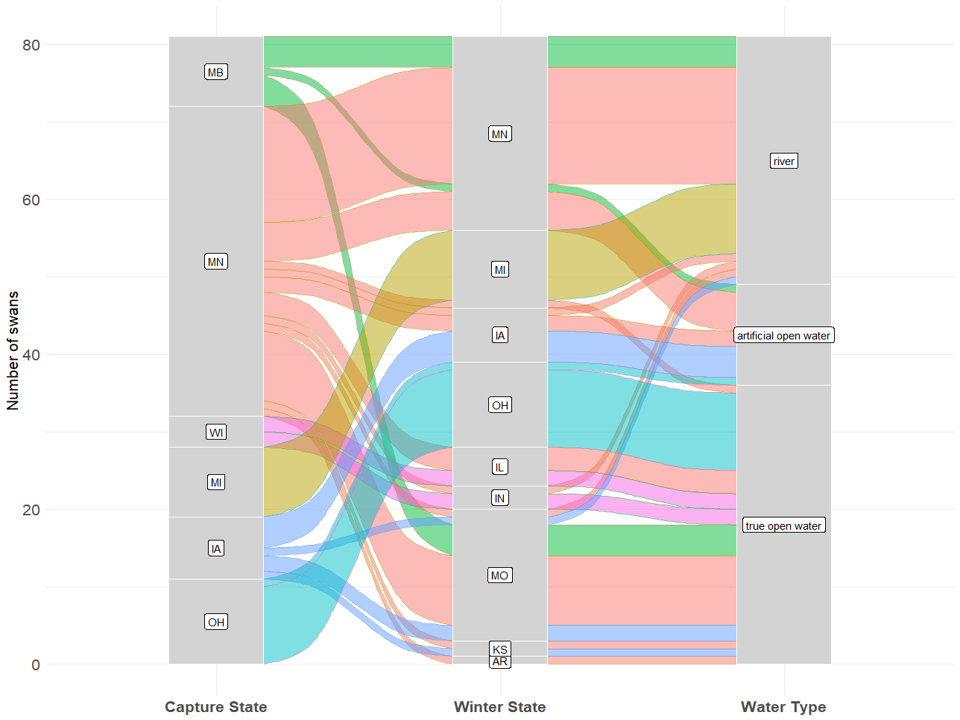
Table 1 Model coefficients, 95% confidence intervals (CI) around coefficients, and t- and _P-_values for the relationship of swan blood lead concentration (in parts per billion) to distance moved from capture location to the farthest point south during autumn migration in 2020.
| Est. | 2.5% | 97.5% | t val. | p | |
|---|---|---|---|---|---|
| (Intercept) | 131.05 | -12.88 | 274.97 | 1.82 | 0.07 |
| lead_ppb | 0.35 | -0.56 | 1.26 | 0.77 | 0.44 |
Manitoba 2020

Whole Project 2021
David Wolfson, Minnesota Cooperative Fish and Wildlife Research Unit, Department of Fisheries, Wildlife, and Conservation Biology, University of Minnesota, St. Paul, Minnesota, USA.
David E. Andersen, U.S. Geological Survey, Minnesota Cooperative Fish and Wildlife Research Unit, 200 Hodson Hall, 1980 Folwell Ave, St. Paul, Minnesota, USA.
John Fieberg, Department of Fisheries, Wildlife, and Conservation Biology, University of Minnesota, St. Paul, Minnesota, USA.
Abstract: The Interior Population (IP) of trumpeter swans (Cygnus buccinator) was established through extensive re-introductions beginning in the late 1960s throughout the Upper Midwest. Across much of their current breeding distribution, IP trumpeter swans have transitioned from a rare to a common component of the regional waterfowl community. However, unlike many other waterfowl species, very little is known about the ecology of IP trumpeter swans, including movement ecology and habitat use at multiple spatial and temporal scales. Beginning in 2019, we began addressing some of these information needs through a collaborative project to deploy GPS-GSM transmitters on trumpeter swans distributed across the IP. In 2019, we deployed 19 transmitters on IP trumpeter swans (7 in Minnesota and 12 in Michigan). In 2020, we deployed an additional 77 transmitters on IP trumpeter swans (10 in Manitoba, 40 in Minnesota, 9 in Iowa, 5 in Wisconsin, 1 in Michigan, 12 in Ohio). In 2021, we deployed an additional 28 transmitters on IP trumpeter swans, 11 of which were re-deployments (1 in Manitoba, 9 in Minnesota, 2 in Iowa, 4 in Wisconsin, 8 in Ohio, and 4 in Arkansas). Movements of marked swans have been highly variable across the IP breeding range, with swans that breed at higher latitudes more likely to migrate and travel longer distances during the winter.
Introduction
Interior Population (IP) trumpeter swans have high intrinsic and economic value as a protected wildlife species. For example, Minnesota citizens enthusiastically invested in the restoration of trumpeter swans through the check off donation program and other funding sources supporting the Minnesota Department of Natural Resources (MNDNR) Nongame Program since the mid-1980s. Since they were re-established beginning in the 1960s and 1970s, IP trumpeter swans have increased dramatically in population size and expanded their distribution significantly. Trumpeter swans in Minnesota are an example of such increases, with an original reintroduction goal of 15 breeding pairs and a revised interim goal of 500 individuals by 2001 (Fig. 1). Far exceeding those goals, by 2015 the Minnesota population was estimated at > 17,000 individuals (Groves 2017), with an estimated annual finite population growth rate of ~1.20 from 2000-2017 (based on observations of trumpeter swans during annual Minnesota waterfowl surveys; Minnesota Department of Natural Resources, unpublished data).
Trumpeter swans currently breed throughout most of the western Great Lakes region, including in Minnesota, Wisconsin, Michigan, Iowa, Manitoba, Ontario, and Ohio. However, beyond estimates of population size and trend and breeding distribution, there is relatively little recent information about their ecology, therefore hindering conservation decision-making. To address current information needs, we initiated a project in 2019 to mark and follow a sample of IP trumpeter swans with GPS-GSM transmitters for multiple years. These transmitters record high-resolution, high frequency location and related data and transmit those data through cellular phone networks, and will allow us to:
- Evaluate year-round swan movements, including determining the locations where swans spend the winter and the timing and duration of their movements.
- Determine whether and where trumpeter swans make molt migrations.
- Evaluate year-round habitat use and selection patterns of trumpeter swans.
- Estimate annual survival rates of trumpeter swans, if sample sizes are adequate and fates (i.e., mortality events) can be determined.
Results of this study will inform current and future IP trumpeter swan conservation by providing basic information about migration, year-round movements, mortality risks, and use of agricultural and other landscapes. As part of this project, location data will be archived and made available to the public via a website (https://trumpeterswan.netlify.com/locations.html; Fig. 2) that summarizes trumpeter swan movements and habitat use. Thus, the project will also offer the opportunity to actively engage and inform the public about how their past investment in conservation made a positive difference to the region’s natural heritage today.
Since inception of the original project centered in Minnesota (where the bulk of IP trumpeter swans breed), additional funding and collaborations with additional project partners have allowed us to expand the scope of the project to include the following research objectives:
- Quantify the extent of gene flow among IP trumpeter swans, their overall genetic diversity, and genetic differentiation from source populations.
- Evaluate the association between migratory behavior and genetic divergence of different groups of trumpeter swans.
- Quantify concentrations of lead in IP trumpeter swans and assess potential sub-lethal effects of lead exposure on migration and annual movements.
In addition to Minnesota, other states and provinces that are also marking trumpeter swans as part of the larger study include Arkansas (through efforts by the Trumpeter Swan Society), Iowa, Manitoba, Michigan, Ohio, and Wisconsin. State biologists from the Nebraska Game and Parks Commission are also contributing blood samples from the High Plains flock of IP trumpeter swans to include in the genetic analyses.
Study Area
Our study area is defined by the current distribution of IP trumpeter swans (Groves 2017). We deployed transmitters on IP trumpeter swans as far north and west as southern Manitoba (51.1° N, 99.7° W), as far south as central Arkansas (35.5° N, 91.9° W), and as far east as central Ohio (40.6° N, 82.7° W). Capture locations occurred in a mix of Laurentian Mixed Forest, Prairie Parkland, Eastern Broadleaf Forest, and Aspen Parklands (Cleland et al. 1997).
Methods
Swan capture: We captured most swans during the definitive prebasic molt period when adults are flightless. In Minnesota during 2019, we used a variety of watercraft to evaluate the efficacy of different capture methods; these included airboats, kayaks, and square-stern canoes with either an outboard or long-tail mud motor. We hand-captured swans using a shepherd’s crook pole. Collaborators captured swans in Michigan using a step deck transom boat with a surface drive motor and a shoulder-mounted netlauncher (CODA Enterprises, Mesa, Arizona, USA).
In Minnesota during 2020, we partnered with staff from the Minnesota DNR and Three Rivers Park District to locate and capture trumpeter swans throughout Minnesota using a flat-bottom jon boat with a lightweight 6.5 horsepower mud motor (Powell Performance Fab, Hutchinson, Minnesota, USA). We implemented COVID-19 safety protocols throughout the summer, which necessitated single-occupancy vehicles, reduced numbers of field staff, social distancing, and use of personal protective equipment. COVID-19 safety protocols also limited our ability to work in close physical proximity with project collaborators, and we therefore captured most swans with a 2-person field crew.
In 2021, the Trumpeter Swan Society and the Arkansas Game and Fish Commission collaborated to capture and mark 4 swans using leg nooses at locations where swans congregate in the winter. We and project collaborators captured and marked all other swans in 2021 by hand during the prebasic molt period, as indicated above.
Protocols for capturing and marking trumpeter swans in U.S. states have been approved by the University of Minnesota Animal Care and Use Committee (protocol no. 1905-37072A), the Minnesota Department of Natural Resources (Special Permit no. 19017), the Michigan Department of Natural Resources (Threatened and Endangered Species Permit TE 175), the U.S. Fish and Wildlife Service (Research & Monitoring Special Use Permit no. K-10-001), and the U.S. Geological Survey Bird Banding Laboratory (Federal Bird Banding Permit no. 21631). All capture and marking of trumpeter swans in Manitoba was conducted under Federal Scientific Permit to Capture and Band Migratory Birds (no. 10271), Federal Animal Care Committee approval (project 20FB02), Provincial Species at Risk Permit (no. SAR20012), and Provincial Park Permit (no. PP-PHQ-20-016).
We marked swans in Minnesota with 55-g neck collars with GPS-GSM transmitter incorporated into the collar housing (Model OrniTrack-N62 3G, Ornitela, Vilnius, Lithuania; see Fig. 3). Collaborators marked swans in Michigan with 140-g GPS transmitters (Model CTT-ES400, Cellular Tracking Technologies, Rio Grande, New Jersey, USA) that were adhered to 64-mm neck collars (Haggie Engraving, Crumpton, Maryland, USA; see Fig. 4). All swans marked in 2020—2021 (except a transmitter redeployed in Michigan recovered from a mortality in 2019, see below) were fitted with Ornitela collars. Neck collars for all swans in this study also had a unique 2-character, alpha-numeric code (black characters on a white background). We took feather samples from all captured swans in 2019 and blood samples from all captured swans in 2020—2021 for genetic analyses and testing for lead concentrations. We clipped the calamus from collected feathers and stored them in 2-mL cryotubes with 95% ethanol solution. We used a 23-gauge, 1-inch needle and a 3-mL syringe to extract 2 mL of blood. Approximately 0.1 mL of blood was deposited on a Whatman FTA card (Sigma-Aldrich, St. Louis, Missouri, USA). We collected the rest of the blood sample in a 2-mL tube containing ethylenediaminetetraacetic acid (EDTA) and refrigerated all tubes until they were received at the diagnostic lab.
During the winter of 2019—2020, 8 of the deployed GPS-GSM collars failed due to extreme temperatures and/or water penetration. To address this issue, we worked with the manufacturer during the off-season to amend the collar design for the next generation of collars we deployed beginning in 2020. We replaced the lightweight foam insulation within the collar housing with a high-density epoxy that is more weather-resistant and have had no more apparent failures due to weather conditions at the time of this report.
Data: Transmitters are programmed to collect GPS locations at 15-min intervals throughout the 24-hr daily period. Locations are stored on-board in internal transmitter memory. Once per day, the transmitters attempt to upload the entire batch of stored locations to the Ornitela back-end database via a cellular network using a General Packet Radio Service (GPRS) connection if available, or a Global System for Mobile Communication (GSM) connection if GPRS is not available. GPRS is a more efficient and upgraded transmission option than GSM. Cellular Tracking Technologies (CTT) transmitters attempt to upload once a day to the CTT back-end database using a GSM connection. If an upload attempt fails, location data are stored on-board the transmitter until a successful connection is made. All new locations from both companies’ databases are uploaded daily to a data repository at Movebank for archiving and future processing.
Analysis of lead concentrations: The Veterinary Diagnostic Laboratory of Iowa State University analyzed blood lead concentrations [parts per billion (ppb)] using inductively coupled plasma mass spectrometry from whole blood samples preserved with EDTA.
To explore potential sub-lethal effects of lead, we used quantile regression to test the relationship between swan blood lead concentration and distance traveled from the capture site to the furthest point south during the winter. We used quantile regression to estimate the conditional median of the response variable as opposed to least squares estimation because it relaxes the assumption of equal variance among residuals and is more appropriate for skewed distributions (Cade and Noon 2003).
Results
We deployed 19 transmitters in Minnesota (n = 7) and Michigan (n = 12) during July—August 2019. One marked swan in Michigan died as a result of a powerline strike but we recovered the transmitter and re-deployed it in summer 2020. We deployed 40 GPS-GSM transmitters on trumpeter swans in Minnesota during June—September 2020. During the summer 2020 field season (June—September), partnering agencies captured and collared 38 trumpeter swans in Iowa (n=9), Manitoba (n=10), Michigan (n=1), Ohio (n=12), and Wisconsin (n=5). In 2021, we deployed an additional 28 transmitters on IP trumpeter swans, 11 of which were re-deployments of GPS-GSM transmitters from swans that had died. Deployments were in Arkansas (n = 4), Iowa (n = 2), Manitoba (n = 1), Minnesota (n = 9), Ohio (n = 8), and Wisconsin (n = 4).
Swans marked during summer 2019 stayed near their breeding territories between the date of capture (July—September) and October. Once temperatures dropped in November, most marked swans in Minnesota left their territories and flew south, although there was considerable variation in the timing of these departures. The earliest longer-distance movements from capture locations (> 100 km) were by swans in the most northern section of the study area. Some swans exhibited a direct flight path to where they settled for the winter whereas others moved shorter distances and lingered in what appear to be stop-over areas for several weeks. Most swans (5 of 7) captured in Minnesota traveled > 100 km from their capture site but only 2 swans in Michigan made movements > 100 km and most remained in the vicinity of their summer territory. Swans predominantly overwintered on major rivers, likely related to the presence of open (i.e., not frozen) water during the winter.
We observed a large amount of variability during autumn 2020 in the prevalence of long-distance migration (Fig. 5). Swans that bred at latitudes ≥ 48° N (n=13) all migrated long distances (\(\bar{x}\)= 767 km, s= 364 km, range = 262—1,330 km). Swans that bred in the middle latitudes of our study area, between 43° and 48° N (n=55), showed a variety of migration strategies, with some traveling over 1,250 km while others stayed within 5 km of their breeding territory (\(\bar{x}\)= 293 km, s= 349 km, range = 5—1,287 km). Swans that bred or were captured during the breeding season at southern latitudes, below 43° N (n = 15), all stayed within 22 km of their breeding territories (\(\bar{x}\)= 8 km, s= 6 km, range = 1—21 km).
Most swans overwintering north of 41° N latitude settled on major rivers, although 13 swans used either lakes with aerators or gravel quarries because they provide water bodies not completely covered with ice during winter (Fig. 6). Most swans that overwintered south of 41° N latitude used a variety of wetlands, lakes, and reservoirs that we presume were ice-free (Fig. 7).
There are currently 78 trumpeter swans with active GPS-GSM collars (defined as having uploaded locations within the last 3 weeks) marked as part of this collaborative project. We have compiled >4 million locations on the Movebank data repository.
We detected the presence of lead in all marked swans, though concentrations were low for almost all swans (\(\bar{x}\)=81 ppb, s=136 ppb, range = 4.3—1,076 ppb). We did not find a significant effect of blood lead concentrations on the distance traveled during autumn 2020 (Table 1).
Project outreach: From August 2019—February 2020, we presented project overviews to a variety of stakeholders at the Mississippi Flyway Council Technical Meeting in Duluth, Minnesota; the 25\(^{th}\) Trumpeter Swan Society Meeting in Alton, Illinois; the 80\(^{th}\) Midwest Fish and Wildlife Conference in Springfield, Illinois; the Northwest Minnesota, Minnesota Department of Natural Resources Managers Meeting in Norris Camp, Minnesota; and the Annual Meeting of the Minnesota Chapter of The Wildlife Society in Willmar, Minnesota. To facilitate public engagement with project objectives and ongoing results we created a project website (https://trumpeterswan.netlify.com).
Since March 2020, we gave project presentations at the 27\(^{th}\) Annual Wildlife Society Conference (virtual), the 81\(^{th}\) Midwest Fish and Wildlife Conference (virtual), and the Mississippi Flyway Council (virtual). The project was featured in 4 local television news segments, 7 newspaper articles, and the press releases of 4 state natural resource agencies. We also were interviewed in 3 different podcast series and presented 2 research seminars for Iowa Young Birders and the West Metro Chapter of Minnesota Master Naturalists. Since adding an analytics-tracking feature to the project website on 10 September 2020, we tracked ~15,000 visitation sessions from >8,000 unique users in 22 different countries.
Discussion
Our preliminary results suggest that IP trumpeter swans exhibit a variety of migration strategies. Individuals that breed in the northern part of the current distribution all made relatively long-distance autumn migrations. Autumn migration distances of swans breeding at mid-latitudes were variable, with some swans moving considerable distances and some swans remaining near their breeding locations. Swans breeding at lower latitudes all remained relatively near their breeding locations. Monitoring swans for additional years will allow us to evaluate consistency of migration between years for individual swans, and whether variation in annual conditions (e.g., winter severity, access to open water during winter) are related to migration behavior. We are also starting genetic analyses to help determine whether genetic lineage is related to migration strategy.
Although we detected lead in all swans we sampled, lead concentrations did not appear to be related to autumn migration distance. Most swans we sampled had blood lead concentrations below those considered to cause lethal or sub-lethal effects. The very high blood concentration we observed in a single swan is perplexing, and the fate of that swan will be of particular interest to monitor.
Future Plans
All original deployments are now complete, and any future fieldwork will only consist of occasional redeployments from collars recovered from mortalities.
We are continuing to host a project website showing the full summary of movement data and other project information. We have started the process of annotating the location data with remote sensing environmental variables, to facilitate future movement and habitat-selection analyses.
We have secured funding for genetic analyses and are working with Dr.
Sushma Reddy and the University of Minnesota Genomics Center to conduct
these analyses. We will be sequencing all samples in early 2022.
Literature Cited
Cade, B. S., and B. R. Noon. 2003. A gentle introduction to quantile regression for ecologists. Frontiers in Ecology and the Environment, 1(8): 412-420.
Cleland, D. T., P. E. Avers, W. H. McNab, M. E. Jensen, R. G. Bailey, T. King, and W. E. Russell. 1997. National hierarchical framework of ecological units. Pages 181-200 in Boyce, M. S. and A. Haney, editors. Ecological management application for sustainable forest and wildlife resources. Yale University Press, New Haven, Connecticut, USA.
Groves, D. J. 2017. The 2015 North American Trumpeter Swan Survey. Unpublished report, U. S. Fish and Wildlife Service, Division of Migratory Bird Management, Juneau, Alaska, USA.
Figure 1. Minnesota trumpeter swan population size estimated from waterfowl surveys conducted over approximately 39% of the area of the state (MN DNR, unpublished data). The trumpeter swan population in Minnesota has increased substantially, dramatically exceeding original and interim population goals, and is currently growing at an annual rate of ~1.20. The current (2020) spring population estimate is near 30,000.
Figure 2. Locations of all marked trumpeter swans are regularly uploaded to a project website that allows users to interactively visualize swan movements. Capture and end locations are represented by colored points. Lines connecting these points show individual movement trajectories observed thus far. This figure represents swan captures in Minnesota and Michigan in 2019.
Figure 3. An example of the Ornitela OrniTrack-N62 collars with GPS-GSM transmitter incorporated into the internal housing that were deployed on trumpeter swans in Minnesota during 2019. All new deployments in 2020 were this design, with a modification to minimize failures experienced in 2019 that were likely the result of water entering the transmitter housing.
Figure 4. An example of the Cellular Tracking Technology CTT-ES400 model transmitters affixed to neck collars that were deployed on trumpeter swans in Michigan during 2019.
Figure 5. Distances traveled by marked trumpeter swans from capture location to the farthest point south during 2020.
Figure 6. Overwintering locations of marked trumpeter swans (through Dec 2020) and whether they settled on rivers, artificial open water (lakes with aerators, quarries, or gravel ponds), or naturally open water (wetlands and lakes without ice).
Figure 7 Flowchart showing the proportions of marked trumpeter swans from each capture state that moved to each state to overwinter (through Dec 2020) and whether they settled on rivers, artificial open water (lakes with aerators, quarries, or gravel ponds), or naturally open water (wetlands and lakes without ice).
Table 1 Model coefficients, 95% confidence intervals (CI) around coefficients, and t- and _P-_values associated with hypothesis tests for coefficients describing the relationship of trumpeter swan blood lead concentration (in parts per billion) to distance moved from capture location to the farthest point south during autumn migration in 2020.
| Est. | 2.5% | 97.5% | t val. | p | |
|---|---|---|---|---|---|
| (Intercept) | 131.05 | -12.88 | 274.97 | 1.82 | 0.07 |
| lead_ppb | 0.35 | -0.56 | 1.26 | 0.77 | 0.44 |
Whole Project 2022
David Wolfson, Minnesota Cooperative Fish and Wildlife Research Unit, Department of Fisheries, Wildlife, and Conservation Biology, University of Minnesota, St. Paul, Minnesota, USA.
David E. Andersen, U.S. Geological Survey, Minnesota Cooperative Fish and Wildlife Research Unit, 200 Hodson Hall, 1980 Folwell Ave, St. Paul, Minnesota, USA.
John Fieberg, Department of Fisheries, Wildlife, and Conservation Biology, University of Minnesota, St. Paul, Minnesota, USA.
Abstract: The Interior Population (IP) of trumpeter swans (Cygnus buccinator) was established through extensive re-introductions beginning in the late 1960s throughout the western Great Lakes region of North America. Across much of their current breeding distribution, IP trumpeter swans have transitioned from a rare to a common component of the regional waterfowl community. However, unlike many other waterfowl species, very little is known about the ecology of IP trumpeter swans, including movement ecology and habitat use at multiple spatial and temporal scales. Beginning in 2019, we began addressing some of these information needs through a collaborative project to deploy GPS-GSM transmitters on trumpeter swans distributed across the IP. In 2019, we deployed 19 transmitters on IP trumpeter swans (7 in Minnesota and 12 in Michigan). In 2020, we deployed an additional 77 transmitters on IP trumpeter swans (10 in Manitoba, 40 in Minnesota, 9 in Iowa, 5 in Wisconsin, 1 in Michigan, 12 in Ohio). In 2021, we deployed an additional 28 transmitters on IP trumpeter swans, 11 of which were re-deployments (1 in Manitoba, 9 in Minnesota, 2 in Iowa, 4 in Wisconsin, 8 in Ohio, and 4 in Arkansas). Preliminary results from analyses on annual movements suggest that 1) the IP undergoes partial migration, where some individuals migrate each year while others don’t, 2) summer/breeding latitude strongly correlates with the extent of migration, 3) timing of migration chronology differs by breeding status, and 4) prevalent use of rivers and anthropogenically-maintained open water allow swans to overwinter at higher latitudes.
Introduction
Interior Population (IP) trumpeter swans have high intrinsic and economic value as a protected wildlife species. For example, Minnesota citizens enthusiastically invested in the restoration of trumpeter swans through the check off donation program and other funding sources supporting the Minnesota Department of Natural Resources (MNDNR) Nongame Program since the mid-1980s. Since they were re-established beginning in the 1960s and 1970s, IP trumpeter swans have increased dramatically in population size and expanded their distribution significantly. Trumpeter swans in Minnesota are an example of such increases, with an original reintroduction goal of 15 breeding pairs and a revised interim goal of 500 individuals by 2001 (Fig. 1). Far exceeding those goals, by 2015 the Minnesota population was estimated at > 17,000 individuals (Groves 2017), with an estimated annual finite population growth rate of ~1.20 from 2000-2017 (based on observations of trumpeter swans during annual Minnesota waterfowl surveys; Minnesota Department of Natural Resources, unpublished data).
Trumpeter swans currently breed throughout most of the western Great Lakes region, including in Minnesota, Wisconsin, Michigan, Iowa, Manitoba, Ontario, and Ohio. However, beyond estimates of population size and trend and breeding distribution, there is relatively little recent information about their ecology, therefore hindering conservation decision-making. To address current information needs, we initiated a project in 2019 to mark and follow a sample of IP trumpeter swans with GPS-GSM transmitters for multiple years. These transmitters record high-resolution, high-frequency location and related data and transmit those data through cellular phone networks, and will allow us to:
- Evaluate year-round swan movements, including determining the locations where swans spend the winter and the timing and duration of their movements.
- Determine whether and where trumpeter swans make molt migrations.
- Evaluate year-round habitat use and selection patterns of trumpeter swans.
- Estimate annual survival rates of trumpeter swans, if sample sizes are adequate and fates (i.e., mortality events) can be determined.
Results of this study will inform current and future IP trumpeter swan conservation by providing basic information about migration, year-round movements, mortality risks, and use of agricultural and other landscapes. As part of this project, location data will be archived and made available to the public via a website (https://trumpeterswan.netlify.com/locations.html; Fig. 2) that summarizes trumpeter swan movements and habitat use. Thus, the project will also offer the opportunity to actively engage and inform the public about how their past investment in conservation made a positive difference to the region’s natural heritage today.
Since inception of the original project centered in Minnesota (where the bulk of IP trumpeter swans breed), additional funding and collaborations with additional project partners have allowed us to expand the scope of the project to include the following research objectives:
- Quantify the extent of gene flow among IP trumpeter swans, their overall genetic diversity, and genetic differentiation from source populations.
- Evaluate the association between migratory behavior and genetic divergence of different groups of trumpeter swans.
- Quantify concentrations of lead in IP trumpeter swans and assess potential sub-lethal effects of lead exposure on migration and annual movements.
In addition to Minnesota, other states and provinces that are also marking trumpeter swans as part of the larger study include Arkansas (through efforts by the Trumpeter Swan Society), Iowa, Manitoba, Michigan, Ohio, and Wisconsin. Biologists from the Nebraska Game and Parks Commission are also contributing blood samples from the High Plains flock of IP trumpeter swans to include in genetic analyses.
Study Area
Our study area is defined by the current distribution of IP trumpeter swans (Groves 2017). We deployed transmitters on IP trumpeter swans as far north and west as southern Manitoba (51.1° N, 99.7° W), as far south as central Arkansas (35.5° N, 91.9° W), and as far east as central Ohio (40.6° N, 82.7° W). Capture locations occurred in a mix of Laurentian Mixed Forest, Prairie Parkland, Eastern Broadleaf Forest, and Aspen Parklands (Cleland et al. 1997).
Methods
Swan capture: We captured most swans during the definitive prebasic molt period when adults are flightless. In Minnesota during 2019, we used a variety of watercraft to evaluate the efficacy of different capture methods; these included airboats, kayaks, and square-stern canoes with either an outboard or long-tail mud motor. We hand-captured swans using a shepherd’s crook pole. Collaborators captured swans in Michigan using a step deck transom boat with a surface drive motor and a shoulder-mounted netlauncher (CODA Enterprises, Mesa, Arizona, USA).
In Minnesota during 2020, we partnered with staff from the Minnesota DNR and Three Rivers Park District to locate and capture trumpeter swans throughout Minnesota using a flat-bottom jon boat with a lightweight 6.5 horsepower mud motor (Powell Performance Fab, Hutchinson, Minnesota, USA). We implemented COVID-19 safety protocols throughout the summer, which necessitated single-occupancy in vehicles, reduced numbers of field staff, social distancing, and use of personal protective equipment. COVID-19 safety protocols also limited our ability to work in close physical proximity with project collaborators, and we therefore captured most swans with a 2-person field crew.
In 2021, the Trumpeter Swan Society and the Arkansas Game and Fish Commission collaborated to capture and mark 4 swans using leg nooses at locations where swans congregate in the winter. We and project collaborators captured and marked all other swans in 2021 by hand during the prebasic molt period, as indicated above.
Protocols for capturing and marking trumpeter swans in U.S. states have been approved by the University of Minnesota Animal Care and Use Committee (protocol no. 1905-37072A), the Minnesota Department of Natural Resources (Special Permit no. 19017), the Michigan Department of Natural Resources (Threatened and Endangered Species Permit TE 175), the U.S. Fish and Wildlife Service (Research & Monitoring Special Use Permit no. K-10-001), and the U.S. Geological Survey Bird Banding Laboratory (Federal Bird Banding Permit no. 21631). All capture and marking of trumpeter swans in Manitoba was conducted under Federal Scientific Permit to Capture and Band Migratory Birds (no. 10271), Federal Animal Care Committee approval (project 20FB02), Provincial Species at Risk Permit (no. SAR20012), and Provincial Park Permit (no. PP-PHQ-20-016).
We marked swans in Minnesota with 55-g neck collars with GPS-GSM transmitter incorporated into the collar housing (Model OrniTrack-N62 3G, Ornitela, Vilnius, Lithuania; see Fig. 3). Collaborators marked swans in Michigan with 140-g GPS transmitters (Model CTT-ES400, Cellular Tracking Technologies, Rio Grande, New Jersey, USA) that were adhered to 64-mm neck collars (Haggie Engraving, Crumpton, Maryland, USA; see Fig. 4). All swans marked in 2020–2021 (except a transmitter redeployed in Michigan recovered from a mortality in 2019, see below) were fitted with Ornitela collars. Neck collars for all swans in this study also had a unique 2-character, alpha-numeric code (black characters on a white background). We took feather samples from all captured swans in 2019 and blood samples from all captured swans in 2020–2021 for genetic analyses and testing for lead concentrations. We clipped the calamus from collected feathers and stored them in 2-mL cryotubes with 95% ethanol solution. We used a 23-gauge, 1-inch needle and a 3-mL syringe to extract 2 mL of blood. Approximately 0.1 mL of blood was deposited on a Whatman FTA card (Sigma-Aldrich, St. Louis, Missouri, USA). We collected the rest of the blood sample in a 2-mL tube containing ethylenediaminetetraacetic acid (EDTA) and refrigerated all tubes until they were received at the diagnostic lab.
During the winter of 2019–2020, 8 of the deployed GPS-GSM collars failed due to extreme temperatures and/or water penetration. To address this issue, we worked with the manufacturer during the off-season to amend the collar design for the next generation of collars we deployed beginning in 2020. We replaced the lightweight foam insulation within the collar housing with a high-density epoxy that is more weather-resistant and have had no further apparent failures due to weather conditions at the time of this report.
GPS-GSM Data Transmission: Transmitters are programmed to collect GPS locations at 15-min intervals throughout the 24-hr daily period. Locations are stored on-board in internal transmitter memory. Once per day, the transmitters attempt to upload the entire batch of stored locations to the Ornitela back-end database via a cellular network using a General Packet Radio Service (GPRS) connection if available, or a Global System for Mobile Communication (GSM) connection if GPRS is not available. GPRS is a more efficient and upgraded transmission option than GSM. Cellular Tracking Technologies (CTT) transmitters attempt to upload once a day to the CTT back-end database using a GSM connection. If an upload attempt fails, location data are stored on-board the transmitter until a successful connection is made. All new locations from both companies’ databases are uploaded daily to a data repository at Movebank for archiving and future processing.
Analysis of lead concentrations: The Veterinary Diagnostic Laboratory of Iowa State University analyzed blood lead concentrations [parts per billion (ppb)] using inductively coupled plasma mass spectrometry from whole blood samples preserved with EDTA.
To explore potential sub-lethal effects of lead, we used quantile regression to test the relationship between swan blood lead concentration and distance traveled from the capture site to the farthest point south during the winter. We used quantile regression to estimate the conditional median of the response variable as opposed to least squares estimation because it relaxes the assumption of equal variance among residuals and is more appropriate for skewed distributions (Cade and Noon 2003).
Analysis of annual movements: To quantify migration phenology throughout the annual cycle, we first calculated yearly time-series of Net-Squared Displacement (NSD) values for each swan, using 1 July as a cutoff date between years for individuals with multiple years of GPS data, and then condensed the dataset to a single average NSD value for each day. After excluding swan-year datasets with <30 days of data, we iteratively fit a series of seven intercept-only piecewise regression models to each time-series. The syntax of each model corresponded to an increasing number (1-7) of intercepts included for average NSD values throughout the time series separated by breakpoints in time where the intercept values transitioned; therefore, intercepts represent stationary segments in time corresponding to periods of the annual cycle (i.e., breeding range, staging areas, and winter ranges), and breakpoints are the transitions between these segments. We retained the best fit model using leave-one-out cross-validation to evaluate predictive performance. We visually inspected the best fit model for each swan-year dataset and removed any that were obvious poor fits such that information from the breakpoints and intercepts would not be useful to describe annual migration phenology.
We extracted parameter values from the fitted piecewise regression models to summarize a number of migration metrics including date of onset of autumn migration, number of stopover areas, duration of time on stopovers, date of arrival on overwintering area, overall distance of migration, departure date from overwintering area, spring arrival, and overall migration duration.
Analysis of population genetics: We extracted DNA from feather and whole blood samples using a Qiagen DNeasy Blood and Tissue Kit (Qiagen, Inc., Valencia, CA, USA) and quantified extractions using a Qubit Flex Fluoremeter (Invitrogen, Waltham, MA, USA). The University of Minnesota Genomics Center (UMGC, Minneapolis, MN, USA) prepared reduced representation libraries for Illumina sequencing following a protocol suitable for double-digest restriction associated DNA sequencing (Peterson et al. 2012). The UMGC digested genomic DNA with two restriction endonucleases (MspI and PstI) and generated single-end 100-basepair reads using a P2 flow cell on an Illumina NextSeq 2000.
After demultiplexing samples, we trimmed adaptor sequences using a custom Perl script from the UMGC. We created an index of the Cygnus buccinator reference genome (NCBI identifier: GCA_019232035.1) using program bwa v0.7.17 and then aligned all reads to the reference genome using the BWA-MEM algorithm (Li and Durbin 2009). We used samtools v1.16.1 to convert the .sam output files from bwa into .bam format (Li et al 2009). We used the ref_map.pl program from STACKS v2.61 to run the gstacks module, assembling loci according to the alignment positions provided for each read, and calling SNPs in each sample (Rochette et al. 2019)
Results
We deployed 19 transmitters in Minnesota (n=7) and Michigan (n=12) during July–August 2019. One marked swan in Michigan died as a result of a powerline strike but we recovered the transmitter and re-deployed it in summer 2020. We deployed 40 GPS-GSM transmitters on trumpeter swans in Minnesota during June–September 2020. During the summer 2020 field season (June–September), partnering agencies captured and collared 38 trumpeter swans in Iowa (n=9), Manitoba (n=10), Michigan (n=1), Ohio (n=12), and Wisconsin (n=5). In 2021, we deployed an additional 28 transmitters on IP trumpeter swans, 11 of which were re-deployments of GPS-GSM transmitters from swans that had died. Deployments were in Arkansas (n=4), Iowa (n=2), Manitoba (n=1), Minnesota (n=9), Ohio (n=8), and Wisconsin (n=4).
Analysis of lead concentrations: We detected the presence of lead in all marked swans, though concentrations were low for almost all swans (\(\bar{x}\) = 81 ppb, s = 136 ppb, range = 4.3–1,076 ppb). We did not find a significant effect of blood lead concentrations on the distance traveled during autumn 2020 (Table 1).
Analysis of annual movements: Swans marked during summer 2019 stayed near their breeding territories between the date of capture (July–September) and October. Once temperatures dropped in November, most marked swans in Minnesota left their territories and flew south, although there was considerable variation in the timing of these departures. The earliest longer distance movements from capture locations (> 100 km) were by swans in the most northern portion of the study area. Some swans exhibited a direct flight path to where they settled for the winter whereas others moved shorter distances and lingered in what appear to be stop-over areas for several weeks. Most swans (5 of 7) captured in Minnesota traveled > 100 km from their capture site but only two swans in Michigan made movements > 100 km and most remained in the vicinity of their summer territory. Swans predominantly overwintered on major rivers, likely related to the presence of open (i.e., not frozen) water during the winter.
We observed high variability during autumn 2020 in the prevalence of long-distance migration (Fig. 5). Swans that bred at latitudes ≥ 48° N (n=13) all migrated long distances (\(\bar{x}\) = 767 km, s = 364 km, range = 262–1,330 km). Swans that bred in the middle latitudes of our study area, between 43° and 48° N (n=55), exhibited a variety of migration strategies, with some traveling >1,250 km while others stayed within 5 km of their breeding territory (\(\bar{x}\) = 293 km, s = 349 km, range = 5–1,287 km). Swans that bred or were captured during the breeding season at southern latitudes, below 43° N (n=15), all stayed within 22 km of their breeding territories (\(\bar{x}\) = 8 km, s = 6 km, range = 1–21 km).
Most swans overwintering north of 41° N latitude settled on major rivers, although 13 swans used either lakes with aerators or gravel quarries because they provide water bodies not completely covered with ice during winter (Fig. 6). Most swans that overwintered south of 41° N latitude used a variety of wetlands, lakes, and reservoirs that we presume were ice-free (Fig. 7).
At the time of this report (January 2023), there are currently 42 trumpeter swans with functioning GPS-GSM collars (defined as having uploaded locations within the last 3 weeks; Fig. 8). We have compiled >5.7 million locations on the Movebank data repository.
Further analysis of the overall migration patterns in 2020 and 2021 continued to suggest that the IP undergoes partial migration, with a continuum of strategies each year including residency, short-distance local movements, regional migrations, and long-distance migration. Breeding latitude, or capture latitude for non-breeders at the time of capture strongly correlated with the overall extent of movement south during the non-breeding season (Fig. 9). Categorizing swans by migration distance (using groups of 0-20 km, >20-100 km, >100-300 km, and >300 km), revealed the largest group underwent long-distance migration (42%), and the other three categories had approximately equivalent numbers (Table 2). Swans that were resident or short-distance migrants typically left their summer home range earlier than individuals that were regional or long-distance migrants, although residents and short-distance migrants returned to their summer home range often and/or remained on it for much of the non-breeding season. We note that these summary statistics do not necessarily pertain to the IP as a whole because our geographic sampling was non-random across the breeding range and primarily targeted breeding adults for capture.
Breeding status was an important factor in the observed timing of migration chronology. Swans that were confirmed to be successful breeders at the time of capture (i.e., observed with cygnets) had a later onset of autumn migration (Fig. 9), an earlier arrival in the spring (Fig. 10), and spent less time away from the breeding territory during the non-breeding season (Fig. 11).
Analysis of population genetics: We took 125 DNA samples from marked swans in this study (or their cygnets) and 15 trumpeter swans in the High Plains Flock in western Nebraska, an isolated group of the IP. We also received 26 DNA samples of Pacific Coast Population (PCP) trumpeter swans from the Burke Museum of Natural History and Culture (Seattle, WA, USA) and 53 DNA samples of PCP and Rocky Mountain Population (RMP) trumpeter swans from collaborators at the Molecular Ecology Lab at the USGS Fort Collins Science Center (Fort Collins, CO, USA).
We have used our bioinformatics pipeline to call single-nucleotide polymorphisms (SNPs) and haplotypes on the 96 samples from the first round of DNA sequencing.
Project outreach: From August 2019–February 2020, we presented project overviews to a variety of stakeholders at the Mississippi Flyway Council Technical Meeting in Duluth, Minnesota; the 25\(^{th}\) Trumpeter Swan Society Meeting in Alton, Illinois; the 80\(^{th}\) Midwest Fish and Wildlife Conference in Springfield, Illinois; the Northwest Minnesota, Minnesota Department of Natural Resources Managers Meeting in Norris Camp, Minnesota; and the Annual Meeting of the Minnesota Chapter of The Wildlife Society in Willmar, Minnesota. To facilitate public engagement with project objectives and ongoing results we created a project website (https://trumpeterswan.netlify.com).
During February 2020–February 2021, we gave project presentations at the 27\(^{th}\) Annual Wildlife Society Conference (virtual), the 81\(^{th}\) Midwest Fish and Wildlife Conference (virtual), and the Mississippi Flyway Council (virtual).
During February 2021–January 2022, we gave project presentations at the 28\(^{th}\) Annual Wildlife Society Conference (virtual), the 7\(^{th}\) International Bio-Logging Symposium (virtual), and the 82\(^{th}\) Midwest Fish andWildlife Conference (virtual),
During 2022 we gave project presentations at the 26\(^{th}\) Trumpeter Swan Society Meeting / 7\(^{th}\) International Swan Symposium in Jackson, Wyoming, the 29\(^{th}\) Annual Wildlife Society Conference in Spokane, Washington, and to the Mississippi Flyway Council (virtual).
The project has been featured in two general science periodicals, four local television news segments, one regional radio interview, eight newspaper articles, and the press releases of four state natural resource agencies. We also were interviewed in three different podcast series and presented three online research seminars to naturalist/citizen science groups.
Since adding an analytics-tracking feature to the project website on 10 September 2020, we tracked ~21,000 visitation sessions from ~11,000 unique users in 56 different countries.
Discussion
Our preliminary results suggest that IP trumpeter swans exhibit a variety of migration strategies. Individuals that breed in the northern part of the current distribution all made relatively long-distance autumn migrations. Autumn migration distances of swans breeding at mid-latitudes were variable, with some swans moving considerable distances and some swans remaining near their breeding locations during the non-breeding season. Swans breeding at lower latitudes all remained relatively near their breeding locations. Monitoring swans for additional years will allow us to evaluate consistency of migration between years for individual swans, and whether variation in annual conditions (e.g., winter severity, access to open water during winter) are related to migration behavior.
Although we detected lead in all swans we sampled, lead concentrations did not appear to be related to autumn migration distance. Most swans we sampled had blood lead concentrations below those considered to cause lethal or sub-lethal effects.
Future Plans
The fieldwork component of this project is now complete. We are continuing to host a project website showing the full summary of swan movement data and other project information.
The analysis of annual movements is nearing completion and we will soon transition to manuscript preparation after consulting with all project partners.
We are currently sequencing the remaining 59 DNA samples from IP
trumpeter swans and 79 samples from the RMP and PCP. After completing
DNA sequencing, we will integrate the latest sequencing reads into our
existing bioinformatic pipeline and move forward with the population
genomics analyses. Next steps include calculating diversity indices
(e.g., observed and expected heterozygosity, nucleotide diversity,
Tajima’s D), population differentiation estimates (e.g., \(F_{st}\), \(D_{xy}\)), and estimating the degree of
population genetic structure.
Literature Cited
Cade, B. S., and B. R. Noon. 2003. A gentle introduction to quantile regression for ecologists. Frontiers in Ecology and the Environment, 1:412–420.
Cleland, D. T., P. E. Avers, W. H. McNab, M. E. Jensen, R. G. Bailey, T. King, and W. E. Russell. 1997. National hierarchical framework of ecological units. Pages 181–200 in Boyce, M. S. and A. Haney, editors. Ecological management application for sustainable forest and wildlife resources. Yale University Press, New Haven, Connecticut, USA.
Li, H. and R. Durbin. 2009. Fast and accurate short read alignment with Burrows-Wheeler transform. Bioinformatics 25:1754–-1760. https://doi.org/10.1093/bioinformatics/btp324.
Li. H., B. Handsaker, A. Wysoker, T. Fennell, J. Ruan, N. Homer, G. Marth, G. Abecasis, and R. Durbin. 2009. The sequence alignment/map format and SAMtools. Bioinformatics 25:2078-–2079
Groves, D. J. 2017. The 2015 North American Trumpeter Swan Survey. Unpublished report, U. S. Fish and Wildlife Service, Division of Migratory Bird Management, Juneau, Alaska, USA.
Peterson, B. K., J. N. Weber, E. H. Kay, H. S. Fisher, and H. E. Hoekstra. 2012. Double digest RADseq: an inexpensive method for de novo SNP discovery and genotyping in model and non-model species. PLoS ONE 7:e37135. https://doi.org.10.1371/journal.pone.0037135.
Rochette, N. C., A. G. Rivera-Colon, and J. M. Catchen. 2019. Stacks 2: Analytical methods for paired-end sequencing improve RADseq-based population genomics. Molecular Ecology 28:4737–4754.
Figure 1. Minnesota trumpeter swan population size estimated from waterfowl surveys conducted over approximately 39% of the area of the state (MN DNR, unpublished data). The trumpeter swan population in Minnesota has increased substantially, dramatically exceeding original and interim population goals, and is currently growing at an annual rate of ~1.20. The 2020 spring population estimate was near 30,000.
Figure 2. Locations of all marked IP trumpeter swans are regularly uploaded to a project website that allows users to interactively visualize swan movements. Capture and end locations are represented by colored points. Lines connecting these points show individual movement trajectories observed thus far. This figure represents swan captures in Minnesota and Michigan in 2019.
Figure 3. An example of the Ornitela OrniTrack-N62 collars with GPS-GSM transmitter incorporated into the internal housing that were deployed on IP trumpeter swans in Minnesota during 2019. All new deployments in 2020 used this design, with a modification to minimize failures experienced in 2019 that were likely the result of water entering the transmitter housing.
Figure 4. An example of the Cellular Tracking Technology CTT-ES400 model transmitters affixed to neck collars that were deployed on IP trumpeter swans in Michigan during 2019.
Figure 5. Distances traveled by marked IP trumpeter swans from capture location to the farthest point south during 2020.
Figure 6. Overwintering locations of marked IP trumpeter swans (through December 2020) and whether they settled on rivers, artificial open water (lakes with aerators, quarries, or gravel ponds), or naturally open water (wetlands and lakes without ice).
Figure 7. Flowchart showing the proportions of marked IP trumpeter swans from each capture state or province and where they moved to overwinter (through December 2020) and whether they settled on rivers, artificial open water (lakes with aerators, quarries, or gravel ponds), or naturally open water (wetlands and lakes without ice).
Figure 8. An overview of GPS telemetry data received from all collared IP trumpeter swans. Each line represents the period of data collection from a single collared swan. The grey regions indicate periods of collar deployment. The black lines are 1 January of each year. State/province abbreviations on the right of each row and the number indicated to the left of the state or province is the number of GPS collars that were deployed in that state/province.
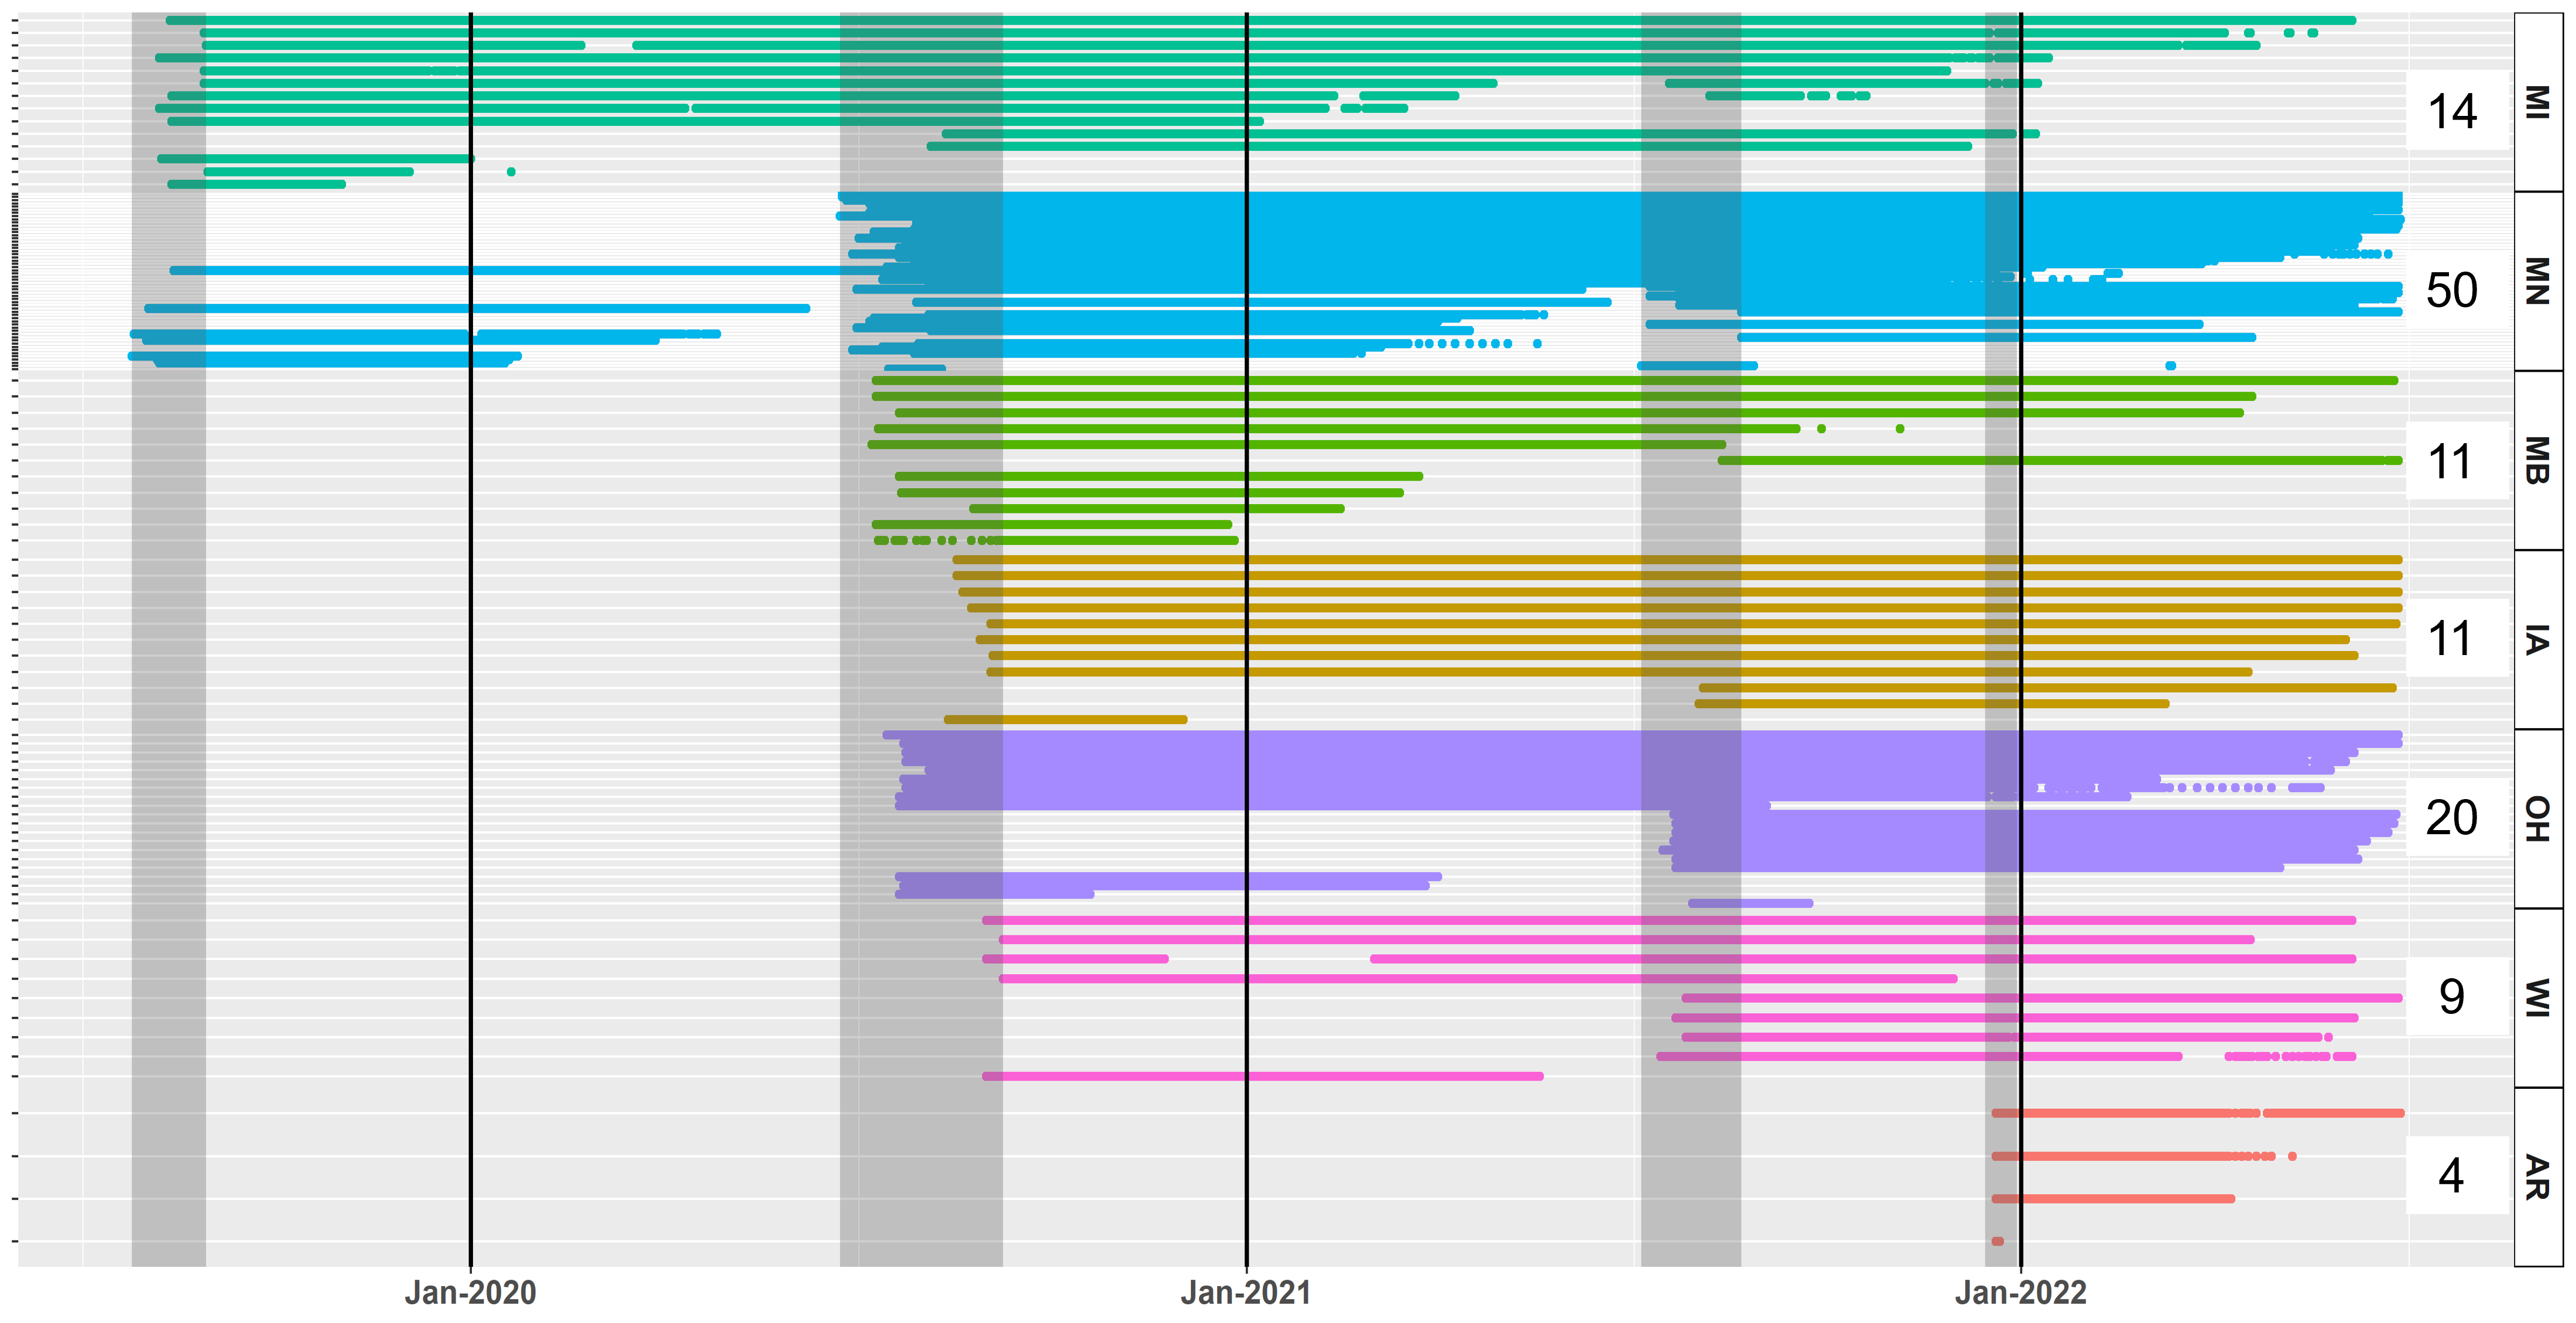
Figure 9. The relationship between the breeding (or capture) latitude of marked IP trumpeter swans and the farthest distance south moved during the non-breeding season in the 2020–2021 and 2021–2022 migration cycles.
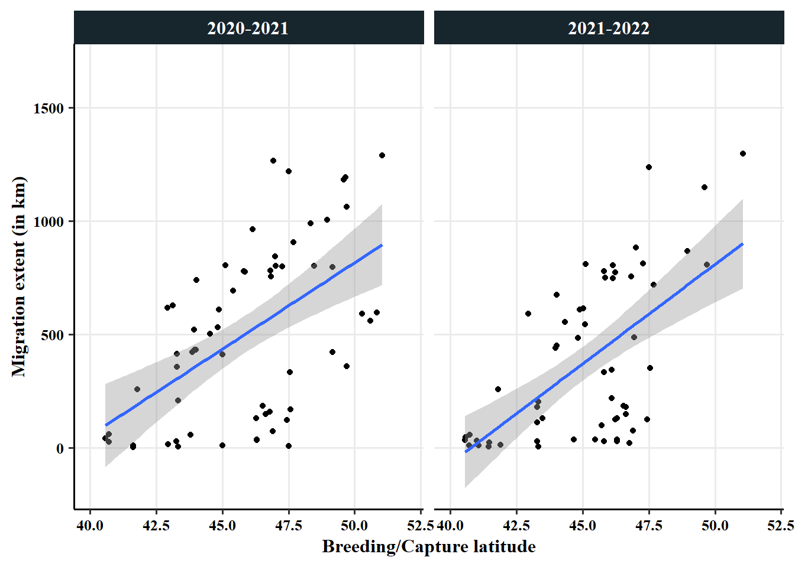
Figure 10. Timing of the onset of IP trumpeter swan autumn departure (defined as the date during July–December when a swan first leaves its breeding/summer territory and subsequently moves >100 km away during the non-breeding season). Swans were considered breeders if cygnets were present at the time of capture, paired if a mate was present but cygnets were not observed, and non-breeders if the swan was alone or in a large group of unpaired swans.
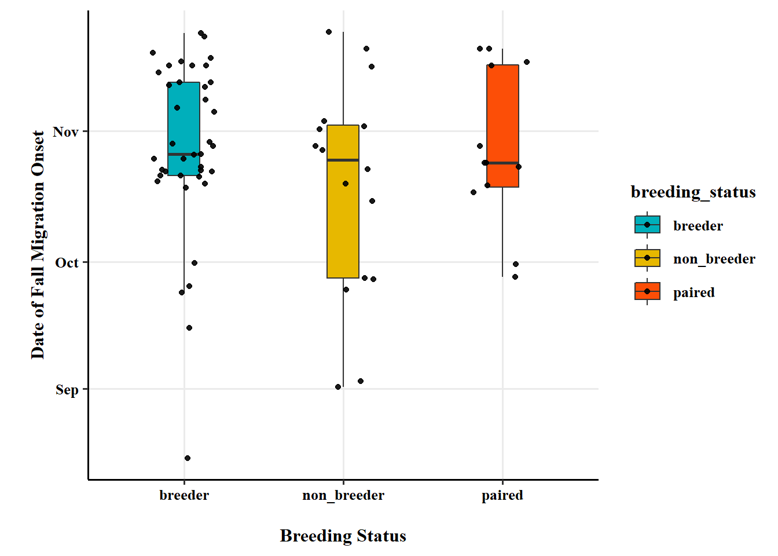
Figure 10. Timing of IP trumpeter swan spring arrival dates (defined as the date during December–July when the swan returns within 10 km of the summer/breeding territory from the previous year, after having moved >100 km from the breeding/summer territory during the non-breeding season). Swans were considered breeders if cygnets were present at the time of capture, paired if a mate was present but cygnets were not observed, and non-breeders if the swan was alone or in a large group of unpaired swans.
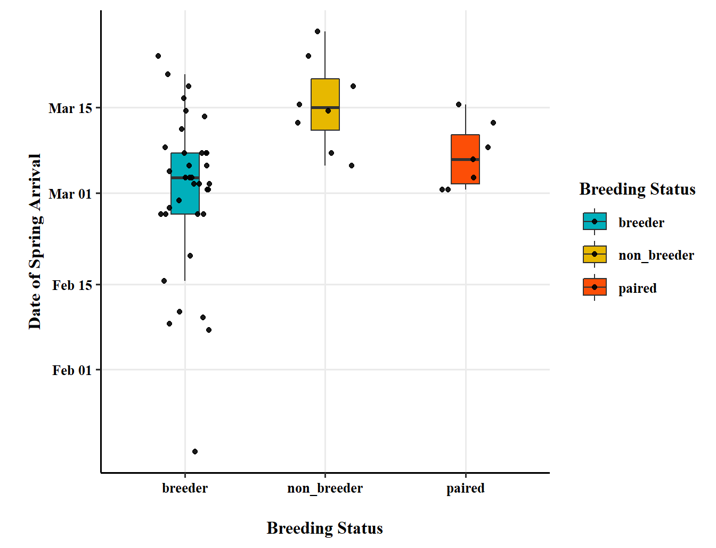
Figure 11. Duration of IP trumpeter swan migration (defined as the difference in time between onset of autumn departure and spring arrival, with all previously described rules defining autumn and spring migration. Swans were considered breeders if cygnets were present at the time of capture, paired if a mate was present but cygnets were not observed, and non-breeders if the swan was alone or in a large group of unpaired swans.
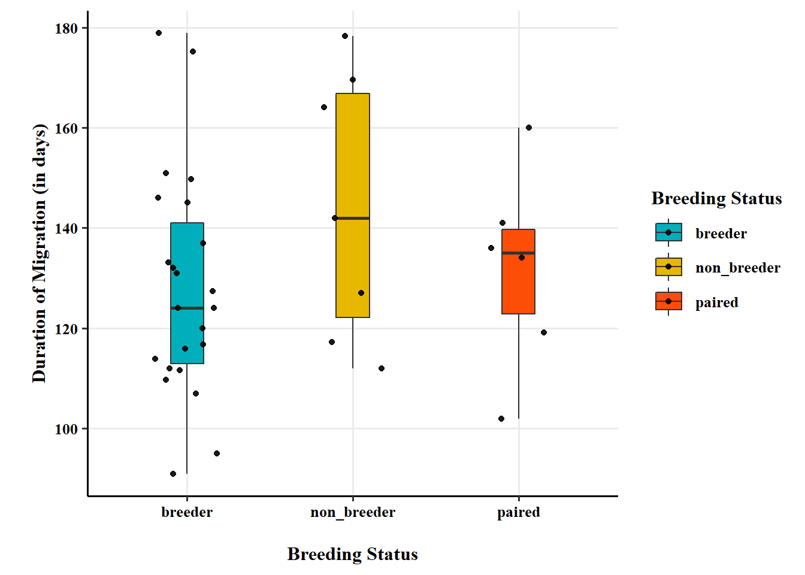
Table 1 Model coefficients, lower and upper 95% confidence intervals (CI), and t and p values associated with hypothesis tests for coefficients describing the relationship of trumpeter swan blood lead concentration (in parts per billion) to distance moved in kilometers from capture location to the farthest point south during autumn migration in 2020.
| Estimate | Lower 95% CI | Upper 95% CI | t value | p value | |
|---|---|---|---|---|---|
| (Intercept) | 131.05 | -12.88 | 274.97 | 1.82 | 0.07 |
| lead_ppb | 0.35 | -0.56 | 1.26 | 0.77 | 0.44 |
Table 2. Summary statistics of each category of IP trumpeter swans separated by their overall displacement from the breeding/summer territory throughout the year (resident < 20 km ; local short distance < 100 km; regional medium distance < 300 km; long-distance > 300 km). We did not consider resident or local migrants to have undergone ‘typical’ migration, and therefore did not estimate a spring arrival date for those individuals.
| Migration category | Year | Number in category | Average first departure | Average spring arrival |
|---|---|---|---|---|
| long-distance | 2020 | 40 | November-03 | March-05 |
| long-distance | 2021 | 26 | October-23 | March-09 |
| regional | 2020 | 9 | October-31 | March-02 |
| regional | 2021 | 14 | October-18 | February-26 |
| local | 2020 | 11 | September-07 | NA |
| local | 2021 | 16 | September-14 | NA |
| resident | 2020 | 14 | September-23 | NA |
| resident | 2021 | 11 | October-14 | NA |
Whole Project 2023
David Wolfson, Minnesota Cooperative Fish and Wildlife Research Unit, Department of Fisheries, Wildlife, and Conservation Biology, University of Minnesota, St. Paul, Minnesota, USA.
David E. Andersen, U.S. Geological Survey, Minnesota Cooperative Fish and Wildlife Research Unit, 200 Hodson Hall, 1980 Folwell Ave, St. Paul, Minnesota, USA.
John Fieberg, Department of Fisheries, Wildlife, and Conservation Biology, University of Minnesota, St. Paul, Minnesota, USA.
Abstract: The Interior Population (IP) of trumpeter swans (Cygnus buccinator) was established through extensive re-introductions beginning in the late 1960s throughout the western Great Lakes region of North America. Across much of their current breeding distribution, IP trumpeter swans have transitioned from a rare to a common component of the regional waterfowl community. However, unlike many other waterfowl species, very little is known about the ecology of IP trumpeter swans, including movement ecology and habitat use at multiple spatial and temporal scales. In 2019, we began addressing some of these information needs through a collaborative project to deploy GPS/GSM transmitters on trumpeter swans distributed across the IP. We deployed 19 transmitters on IP trumpeter swans (7 in Minnesota and 12 in Michigan) in 2019. In 2020, we deployed an additional 77 transmitters on IP trumpeter swans (10 in Manitoba, 40 in Minnesota, 9 in Iowa, 5 in Wisconsin, 1 in Michigan, 12 in Ohio). In 2021, we deployed an additional 28 transmitters on IP trumpeter swans, 11 of which were re-deployments (1 in Manitoba, 9 in Minnesota, 2 in Iowa, 4 in Wisconsin, 8 in Ohio, and 4 in Arkansas). Preliminary results from analyses on annual movements suggest that 1) the IP undergoes partial migration, where some individuals migrate each year while others do not, 2) summer/breeding latitude strongly correlates with the extent of migration, 3) migration chronology differs by breeding status, and 4) prevalent use of rivers and anthropogenically-maintained open water allow swans to overwinter at higher latitudes.
Introduction
Interior Population (IP) trumpeter swans have high intrinsic and economic value as a protected wildlife species. For example, Minnesota citizens enthusiastically invested in the restoration of trumpeter swans through the check off donation program and other funding sources supporting the Minnesota Department of Natural Resources (MNDNR) Nongame Program since the mid-1980s. Following initial efforts to re-establish IP trumpeter swans in the 1960s and 1970s, the IP has increased dramatically in population size and expanded its distribution dramatically. Trumpeter swans in Minnesota are an example of such increases, with an original reintroduction goal of 15 breeding pairs and a revised interim goal of 500 individuals by 2001 (Fig. 1). Far exceeding those goals, by 2015 the Minnesota population was estimated at > 17,000 individuals (Groves 2017), with an estimated annual finite population growth rate of ~1.20 from 2000-2017 (based on observations of trumpeter swans during annual Minnesota waterfowl surveys; Minnesota Department of Natural Resources, unpublished data).
Trumpeter swans currently breed throughout most of the western Great Lakes region, including in Minnesota, Wisconsin, Michigan, Iowa, Manitoba, Ontario, and Ohio. However, beyond estimates of population size and trend and breeding distribution, there is relatively little recent information about their ecology, therefore hindering conservation decision-making. To address current information needs, we initiated a project in 2019 to mark and follow a sample of IP trumpeter swans with GPS/GSM transmitters for multiple years. These transmitters record high-resolution, high-frequency location and related data and transmit those data through cellular phone networks, and will allow us to:
- Evaluate year-round swan movements, including determining the locations where swans spend the winter and the timing and duration of their movements.
- Determine whether and where trumpeter swans make molt migrations.
- Evaluate year-round habitat use and selection patterns of trumpeter swans.
- Estimate annual survival rates of trumpeter swans, if sample sizes are adequate and fates (i.e., mortality events) can be determined.
Results of this study will inform current and future IP trumpeter swan conservation by providing basic information about migration, year-round movements, mortality risks, and use of agricultural and other landscapes. As part of this project, location data will be archived and made available to the public via a website (https://trumpeterswan.netlify.com/locations.html; Fig. 2) that summarizes trumpeter swan movements and habitat use. Thus, the project will also offer the opportunity to actively engage and inform the public about how their past investment in conservation made a positive difference to the region’s natural heritage today.
Since inception of the original project centered in Minnesota (where the bulk of IP trumpeter swans breed), additional funding and collaborations with additional project partners have allowed us to expand the scope of the project to include the following research objectives:
- Quantify the extent of gene flow among IP trumpeter swans, their overall genetic diversity, and genetic differentiation from source populations.
- Evaluate the association between migratory behavior and genetic divergence of different groups of trumpeter swans.
- Quantify concentrations of lead in IP trumpeter swans and assess potential sub-lethal effects of lead exposure on migration and annual movements.
In addition to Minnesota, other states and provinces that are also marking trumpeter swans as part of the larger study include Arkansas (through efforts by the Trumpeter Swan Society), Iowa, Manitoba, Michigan, Ohio, and Wisconsin. Biologists from the Nebraska Game and Parks Commission are also contributing blood samples from the High Plains flock of IP trumpeter swans to include in genetic analyses.
Study Area
Our study area is defined by the current distribution of IP trumpeter swans (Groves 2017). We deployed transmitters on IP trumpeter swans as far north and west as southern Manitoba (51.1° N, 99.7° W), as far south as central Arkansas (35.5° N, 91.9° W), and as far east as central Ohio (40.6° N, 82.7° W). Capture locations occurred in a mix of Laurentian Mixed Forest, Prairie Parkland, Eastern Broadleaf Forest, and Aspen Parklands (Cleland et al. 1997).
Methods
Swan capture: We captured most swans during the definitive prebasic molt period when adults are flightless. In Minnesota during 2019, we used a variety of watercraft to evaluate the efficacy of different capture methods; these included airboats, kayaks, and square-stern canoes with either an outboard or long-tail mud motor. We hand-captured swans using a shepherd’s crook pole. Collaborators captured swans in Michigan using a step deck transom boat with a surface drive motor and a shoulder-mounted netlauncher (CODA Enterprises, Mesa, Arizona, USA).
In Minnesota during 2020, we partnered with staff from the Minnesota DNR and Three Rivers Park District to locate and capture trumpeter swans throughout Minnesota using a flat-bottom jon boat with a lightweight 6.5 horsepower mud motor (Powell Performance Fab, Hutchinson, Minnesota, USA). We implemented COVID-19 safety protocols throughout the summer, which necessitated single-occupancy in vehicles, reduced numbers of field staff, social distancing, and use of personal protective equipment. COVID-19 safety protocols also limited our ability to work in close physical proximity with project collaborators, and we therefore captured most swans with a 2-person field crew.
In 2021, the Trumpeter Swan Society and the Arkansas Game and Fish Commission collaborated to capture and mark 4 swans using leg nooses at locations where swans congregate in the winter. We and project collaborators captured and marked all other swans in 2021 by hand during the prebasic molt period, as indicated above.
Protocols for capturing and marking trumpeter swans in U.S. states have been approved by the University of Minnesota Animal Care and Use Committee (protocol no. 1905-37072A), the Minnesota Department of Natural Resources (Special Permit no. 19017), the Michigan Department of Natural Resources (Threatened and Endangered Species Permit TE 175), the U.S. Fish and Wildlife Service (Research & Monitoring Special Use Permit no. K-10-001), and the U.S. Geological Survey Bird Banding Laboratory (Federal Bird Banding Permit no. 21631). All capture and marking of trumpeter swans in Manitoba was conducted under Federal Scientific Permit to Capture and Band Migratory Birds (no. 10271), Federal Animal Care Committee approval (project 20FB02), Provincial Species at Risk Permit (no. SAR20012), and Provincial Park Permit (no. PP-PHQ-20-016). Capture and marking of swans in Arkansas was conducted under Scientific Collection permit no. 011420213 from the Arkansas Game & Fish Commission.
We marked swans in Minnesota with 55-g neck collars with GPS/GSM transmitter incorporated into the collar housing (Model OrniTrack-N62 3G, Ornitela, Vilnius, Lithuania; see Fig. 3). Collaborators marked swans in Michigan with 140-g GPS transmitters (Model CTT-ES400, Cellular Tracking Technologies, Rio Grande, New Jersey, USA) that were adhered to 64-mm neck collars (Haggie Engraving, Crumpton, Maryland, USA; see Fig. 4). All swans marked in 2020–2021 (except a transmitter redeployed in Michigan recovered from a mortality in 2019, see below) were fitted with Ornitela collars. Neck collars for all swans in this study also had a unique 2-character, alpha-numeric code (black characters on a white background). We took feather samples from all captured swans in 2019 and blood samples from all captured swans in 2020–2021 for genetic analyses and testing for lead concentrations. We clipped the calamus from collected feathers and stored them in 2-mL cryotubes with 95% ethanol solution. We used a 23-gauge, 1-inch needle and a 3-mL syringe to extract ~2 mL of blood. Approximately 0.1 mL of blood was deposited on a Whatman FTA card (Sigma-Aldrich, St. Louis, Missouri, USA). We collected the rest of the blood sample in a 2-mL tube containing ethylenediaminetetraacetic acid (EDTA) and refrigerated all tubes until they were received at the diagnostic lab.
During the winter of 2019–2020, 8 of the deployed GPS-GSM collars failed due to extreme temperatures and/or water penetration. To address this issue, we worked with the manufacturer during the off-season to amend the collar design for the next generation of collars we deployed beginning in 2020. We replaced the lightweight foam insulation within the collar housing with a high-density epoxy that is more weather-resistant and have had no further apparent failures due to weather conditions.
GPS-GSM Data Transmission: Transmitters are programmed to collect GPS locations at 15-min intervals throughout the 24-hr daily period. Locations are stored on-board in internal transmitter memory. Once per day, the transmitters attempt to upload the entire batch of stored locations to the Ornitela back-end database via a cellular network using a General Packet Radio Service (GPRS) connection if available, or a Global System for Mobile Communication (GSM) connection if GPRS is not available. GPRS is a more efficient and upgraded transmission option than GSM. Cellular Tracking Technologies (CTT) transmitters attempt to upload once a day to the CTT back-end database using a GSM connection. If an upload attempt fails, location data are stored on-board the transmitter until a successful connection is made. All new locations from both companies’ databases are uploaded daily to a data repository at Movebank for archiving and future processing.
Analysis of lead concentrations: The Veterinary Diagnostic Laboratory of Iowa State University analyzed blood lead concentrations [parts per billion (ppb)] using inductively coupled plasma mass spectrometry from whole blood samples preserved with EDTA.
To explore potential sub-lethal effects of lead, we used quantile regression to test the relationship between swan blood lead concentration and distance traveled from the capture site to the farthest point south during the winter. We used quantile regression to estimate the conditional median of the response variable as opposed to least squares estimation because it relaxes the assumption of equal variance among residuals and is more appropriate for skewed distributions (Cade and Noon 2003).
Analysis of annual movements: To quantify migration phenology throughout the annual cycle, we first calculated yearly time-series of Net-Squared Displacement (NSD) values for each swan, using 1 July as a cutoff date between years for individuals with multiple years of GPS data, and then condensed the dataset to a single average NSD value for each day. After excluding swan-year datasets with <30 days of data, we iteratively fit a series of seven intercept-only piecewise regression models to each time-series. The syntax of each model corresponded to an increasing number (1-7) of intercepts included for average NSD values throughout the time series separated by breakpoints in time where the intercept values transitioned; therefore, intercepts represent stationary segments in time corresponding to periods of the annual cycle (i.e., breeding range, staging areas, and winter ranges), and breakpoints are the transitions between these segments. We retained the best fit model using leave-one-out cross-validation to evaluate predictive performance. We visually inspected the best fit model for each swan-year dataset and removed any that were obvious poor fits such that information from the breakpoints and intercepts would not be useful to describe annual migration phenology.
We extracted parameter values from the fitted piecewise regression models to summarize a number of migration metrics including date of onset of autumn migration, overall distance of migration, spring arrival, and overall migration duration.
To test associations between predictor variables and migration phenology, we fit separate linear mixed models (LMM) using the lme4 package to each response (autumn departure date, spring arrival date, and migration duration), with a random intercept for each individual to account for repeated measures (i.e., multiple migrations by the same individual), and fixed effects for sex, breeding status, and breeding latitude (Bates et al. 2014). For the LMMs fit to autumn departure dates and migration duration, we estimated the variance term for the random intercept to be 0, so we dropped the random effect and refit linear models with the same set of covariates. The lack of among-individual heterogeneity after accounting for fixed effects may reflect a true signal or may simply be the result of insufficient across-year repeated measures within the same set of individuals.
Analysis of population genetics: We extracted DNA from feather and whole blood samples using a Qiagen DNeasy Blood and Tissue Kit (Qiagen, Inc., Valencia, CA, USA) and quantified extractions using a Qubit Flex Fluoremeter (Invitrogen, Waltham, MA, USA). The University of Minnesota Genomics Center (UMGC, Minneapolis, MN, USA) prepared reduced representation libraries for Illumina sequencing following a protocol suitable for double-digest restriction associated DNA sequencing (Peterson et al. 2012). The UMGC digested genomic DNA with two restriction endonucleases (MspI and PstI) and generated single-end 100-basepair reads using a P2 flow cell on an Illumina NextSeq 2000.
After demultiplexing samples, we trimmed adaptor sequences using a custom Perl script from the UMGC. We created an index of the Cygnus buccinator reference genome (NCBI identifier: GCA_019232035.1) using program bwa v0.7.17 and then aligned all reads to the reference genome using the BWA-MEM algorithm (Li and Durbin 2009). We used samtools v1.16.1 to convert the .sam output files from bwa into .bam format (Li et al. 2009). We used the ref_map.pl program from STACKS v2.61 to run the gstacks module, assembling loci according to the alignment positions provided for each read, and calling single-nucleotide polymorphisms (SNPs) in each sample (Rochette et al. 2019). We tested for genetic clustering using 3 similar approaches: 1) program STRUCTURE v2.3.4, 2) principal component analysis (PCA) of the covariance matrix of the SNP data using the adegenet v2.1.8 R package, and 3) discriminant analysis of principal components using the adegenet v2.1.8 R package with 150 principal components retained and 3 discriminant functions saved (Pritchard et al. 2000; Jombart 2008).
Results
We deployed 19 transmitters in Minnesota (n=7) and Michigan (n=12) during July–August 2019. One marked swan in Michigan died as a result of a powerline strike but we recovered the transmitter and re-deployed it in summer 2020. We deployed 40 GPS/GSM transmitters on trumpeter swans in Minnesota during June–September 2020. During the summer 2020 field season (June–September), partnering agencies captured and collared 38 trumpeter swans in Iowa (n=9), Manitoba (n=10), Michigan (n=1), Ohio (n=12), and Wisconsin (n=5). In 2021, we deployed an additional 28 transmitters on IP trumpeter swans, 11 of which were re-deployments of GPS-GSM transmitters from swans that had died. Deployments were in Arkansas (n=4), Iowa (n=2), Manitoba (n=1), Minnesota (n=9), Ohio (n=8), and Wisconsin (n=4).
Analysis of lead concentrations: We detected the presence of lead in all marked swans, though concentrations were low for almost all swans (\(\bar{x}\) = 85 ppb, s = 123 ppb, range = 4.3–1,076 ppb). We did not find a significant effect of blood lead concentrations on the distance traveled during autumn 2020 (Table 1).
Analysis of annual movements: Swans marked during summer 2019 stayed near their breeding territories between the date of capture (July–September) and October. Once temperatures dropped in November, most marked swans in Minnesota left their territories and flew south, although there was considerable variation in the timing of these departures. The earliest longer distance movements from capture locations (> 100 km) were by swans in the most northern portion of the study area. Some swans exhibited a direct flight path to where they settled for the winter whereas others moved shorter distances and lingered in what appear to be stop-over areas for several weeks. Most swans (5 of 7) captured in Minnesota traveled > 100 km from their capture site but only two swans in Michigan made movements > 100 km and most remained in the vicinity of their summer territory. Swans predominantly overwintered on major rivers, likely related to the presence of open (i.e., not frozen) water during the winter.
We observed high variability during autumn 2020 in the prevalence of long-distance migration (Fig. 5). Swans that bred at latitudes ≥ 48° N (n=13) all migrated long distances (\(\bar{x}\) = 767 km, s = 364 km, range = 262–1,330 km). Swans that bred in the middle latitudes of our study area, between 43° and 48° N (n=55), exhibited a variety of migration strategies, with some traveling >1,250 km while others stayed within 5 km of their breeding territory (\(\bar{x}\) = 293 km, s = 349 km, range = 5–1,287 km). Swans that bred or were captured during the breeding season at southern latitudes, below 43° N (n=15), all stayed within 22 km of their breeding territories (\(\bar{x}\) = 8 km, s = 6 km, range = 1–21 km).
Most swans overwintering north of 41° N latitude settled on major rivers, although 13 swans used either lakes with aerators or gravel quarries because they provide water bodies not completely covered with ice during winter (Fig. 6). Most swans that overwintered south of 41° N latitude used a variety of wetlands, lakes, and reservoirs that we presume were ice-free (Fig. 7).
At the time of this report (January 2024), there are currently 9 trumpeter swans with functioning GPS/GSM collars (defined as having uploaded locations within the last 3 weeks; Fig. 8). We have compiled >6.3 million locations in the Movebank data repository.
Further analysis of the overall migration patterns in 2020 and 2021 continued to suggest that the IP undergoes partial migration, with a continuum of strategies each year including residency, short-distance local movements, regional migrations, and long-distance migration. Breeding latitude, or capture latitude for non-breeders at the time of capture strongly correlated with the overall extent of movement south during the non-breeding period (Fig. 9). Categorizing swans by migration distance (using groups of 0-20 km, >20-100 km, >100-300 km, and >300 km), revealed the largest group underwent long-distance migration (42%), and the other three categories had approximately equivalent numbers (Table 2). Swans that were resident or short-distance migrants typically left their summer home range earlier than individuals that were regional or long-distance migrants, although residents and short-distance migrants returned to their summer home range often and/or remained on it for much of the non-breeding period. We note that these summary statistics represent the patterns we observed in the swans in our sample, which was non-random (but spread broadly through the IP breeding distribution) and primarily targeted breeding adults for capture.
Long-distance migrants at higher latitudes left territories earlier in autumn than swans at lower latitudes, though the confidence interval for the coefficient associated with breeding latitude spanned 0 (\(\beta\) = -1.3, 95% CI = -3.0–0.5; Fig. 13). Estimated autumn departure dates of breeding swans were, on average, 11 days (95% CI = -0.4–22.4) later than non-breeders, and 8 days (95% CI = -4.2–19.4) later than paired swans (Fig. 13). Long-distance migrants that traveled >100 km during the non-breeding period and returned to within 10 km of their previous summer territory arrived earliest at southern latitudes. On average, swans arrived 5 days (95% CI = 3.9–6.4) later for every increase of 1 degree of breeding latitude (corresponding to approximately 111 km; Fig. 13). Differences in spring arrival between breeding categories were minimal, and confidence intervals spanned 0 for all two-way comparisons (breeding–non-breeder, \(\beta\) = 2.7, 95% CI = -8.9–14.4; breeder–paired, \(\beta\) = -3.1, 95% CI = -12.2–5.9; non-breeder–paired, \(\beta\)=-5.9, 95% CI = -18.6–6.9; Fig. 13). We did not detect an association between migration duration and breeding latitude (= 0.2, 95% CI = -4.4–4.8; Fig. 13). Breeders had the shortest average migration duration of 125 days, 19 days (95% CI = -50.1–11.8) less than non-breeders, and 13 days (95% CI = -36.2–9.3) less than paired swans (Fig. 13).
Analysis of population genetics: After filtering for data quality, we were able to use 134 DNA samples from marked swans in this study (or their cygnets) and 15 trumpeter swans in the High Plains (HP) Flock in western Nebraska, a geographically isolated group of the IP. We also used 44 DNA samples of Pacific Coast Population (PCP) trumpeter swans and 31 DNA samples of Rocky Mountain Population (RMP) trumpeter swans from the Burke Museum of Natural History and Culture (Seattle, WA, USA) and collaborators at the Molecular Ecology Lab at the USGS Fort Collins Science Center (Fort Collins, CO, USA). Population structure analysis revealed that there are four distinct clusters of genetic variability that correspond with the IP, HP, PCP, and RMP swan groups (Fig. 14). Nucleotide diversity was highest in the IP and PCP, whereas RMP and HP diversity level were substantially lower, likely due to historical bottlenecks within each of those groups. All groups exhibited low levels of inbreeding, although HP \(F_{IS}\) levels indicated more evidence of inbreeding than the other 3 groups. Pairwise \(F_{ST}\) values indicated moderate or high levels of genetic variability between groups except for swans from the HP flock.
Project outreach: From August 2019—-February 2020, we presented project overviews to a variety of stakeholders at the Mississippi Flyway Council Technical Meeting in Duluth, Minnesota; the \(25^{th}\) Trumpeter Swan Society Meeting in Alton, Illinois; the \(80^{th}\) Midwest Fish and Wildlife Conference in Springfield, Illinois; the Northwest Minnesota, Minnesota Department of Natural Resources Managers Meeting in Norris Camp, Minnesota; and the Annual Meeting of the Minnesota Chapter of The Wildlife Society in Willmar, Minnesota. To facilitate public engagement with project objectives and ongoing results, we created a project website (https://trumpeterswan.netlify.com).
During February 2020-—February 2021, we gave project presentations at the \(27^{th}\) Annual Wildlife Society Conference (virtual), the \(81^{th}\) Midwest Fish and Wildlife Conference (virtual), and the Mississippi Flyway Council (virtual).
During February 2021-—January 2022, we gave project presentations at the \(28^{th}\) Annual Wildlife Society Conference (virtual), the \(7^{th}\) International Bio-Logging Symposium (virtual), and the \(82^{th}\) Midwest Fish and Wildlife Conference (virtual),
During 2022 we gave project presentations at the \(26^{th}\) Trumpeter Swan Society Meeting / \(7^{th}\) International Swan Symposium in Jackson, Wyoming, the \(29^{th}\) Annual Wildlife Society Conference in Spokane, Washington, and to the Mississippi Flyway Council (virtual).
During 2023 we gave a project presentation at the \(30^{th}\) Annual Wildlife Society Conference in Louisville, Kentucky.
The project has been featured in two general science periodicals, four local television news segments, one regional radio interview, eight newspaper articles, and the press releases of four state natural resources agencies. We also were interviewed in three different podcast series and presented three online research seminars to naturalist/citizen science groups.
Since adding an analytics-tracking feature to the project website on 10 September 2020, we tracked ~29,656 visitation sessions from ~18,462 unique users in 60 different countries.
Discussion
Our results indicated IP trumpeter swans exhibit a variety of migration strategies. Individuals that breed in the northern part of the current distribution all made relatively long-distance autumn migrations. Autumn migration distances of swans breeding at mid-latitudes were variable, with some swans moving considerable distances and some swans remaining near their breeding locations during the non-breeding season. Swans breeding at lower latitudes all remained relatively near their breeding locations.
Although we detected lead in all swans we sampled, lead concentrations did not appear to be related to autumn migration distance. Most swans we sampled had blood lead concentrations below those considered to cause lethal or sub-lethal effects.
Preliminary genetic analyses indicate that the Interior Population has relatively high genetic variability, does not show evidence of inbreeding, and has clear differentiation from its source populations.
Future Plans
The fieldwork component of this project is now complete. We are continuing to host a project website showing the full summary of swan movement data and other project information.
Analysis of lead concentrations: The collection of lead concentration data is complete. We are currently working on a draft of a manuscript for publication.
Analysis of annual movements: The analysis of annual movements is complete, we have drafted a manuscript, and after collecting feedback from coauthors, we will submit to a peer-reviewed journal for expected publication in late 2024.
Analysis of population genetics: We have completed sequencing all DNA samples from the IP, RMP, and PCP. We are currently working on remaining genetic analyses and drafting a manuscript for publication.
Literature Cited
Bates, D., M. Machler, B. Bolker, adn S. Walker. 2014. Fitting linear mixed-effects models using lme4. arXiv. https://arxiv.org/abs/1406.5823.
Cade, B. S., and B. R. Noon. 2003. A gentle introduction to quantile regression for ecologists. Frontiers in Ecology and the Environment 1:412–420.
Cleland, D. T., P. E. Avers, W. H. McNab, M. E. Jensen, R. G. Bailey, T. King, and W. E. Russell. 1997. National hierarchical framework of ecological units. Pages 181–200 in Boyce, M. S. and A. Haney, editors. Ecological management application for sustainable forest and wildlife resources. Yale University Press, New Haven, Connecticut, USA.
Jombart, T. 2008. Adegenet: A R package for the multivariate analysis of genetic markers. Bioinformatics 24:1403–1405.
Li, H. and R. Durbin. 2009. Fast and accurate short read alignment with Burrows-Wheeler transform. Bioinformatics 25:1754–-1760. https://doi.org/10.1093/bioinformatics/btp324.
Li. H., B. Handsaker, A. Wysoker, T. Fennell, J. Ruan, N. Homer, G. Marth, G. Abecasis, and R. Durbin. 2009. The sequence alignment/map format and SAMtools. Bioinformatics 25:2078-–2079.
Groves, D. J. 2017. The 2015 North American Trumpeter Swan Survey. Unpublished report, U. S. Fish and Wildlife Service, Division of Migratory Bird Management, Juneau, Alaska, USA.
Peterson, B. K., J. N. Weber, E. H. Kay, H. S. Fisher, and H. E. Hoekstra. 2012. Double digest RADseq: an inexpensive method for de novo SNP discovery and genotyping in model and non-model species. PLoS ONE 7:e37135. https://doi.org.10.1371/journal.pone.0037135.
Pritchard, J. K., M. Stephens, and P. Donnelly. 2000. Inference of population structure using multilocus genotype data. Genetics 155:945–959.
Rochette, N. C., A. G. Rivera-Colon, and J. M. Catchen. 2019. Stacks 2: Analytical methods for paired-end sequencing improve RADseq-based population genomics. Molecular Ecology 28:4737–4754.
Figure 1. Minnesota trumpeter swan population size estimated from waterfowl surveys conducted over approximately 39% of the area of the state (MN DNR, unpublished data). The trumpeter swan population in Minnesota has increased substantially, dramatically exceeding original and interim population goals, and is currently growing at an annual rate of ~1.20. The 2020 spring population estimate was near 30,000.
Figure 2. Locations of all marked IP trumpeter swans are regularly uploaded to a project website that allows users to interactively visualize swan movements. Capture and end locations are represented by colored points. Lines connecting these points show individual movement trajectories observed thus far. This figure represents swan captures in Minnesota and Michigan in 2019.
Figure 3. An example of the Ornitela OrniTrack-N62 collars with GPS/GSM transmitter incorporated into the internal housing that were deployed on IP trumpeter swans in Minnesota during 2019. All new deployments in 2020 used this design, with a modification to minimize failures experienced in 2019 that were likely the result of water entering the transmitter housing.
Figure 4. An example of the Cellular Tracking Technology CTT-ES400 model transmitters affixed to neck collars that were deployed on IP trumpeter swans in Michigan during 2019.
Figure 5. Distances traveled by marked IP trumpeter swans from capture location to the farthest point south during 2020.
Figure 6. Overwintering locations of marked IP trumpeter swans (through December 2020) and whether they settled on rivers, artificial open water (lakes with aerators, quarries, or gravel ponds), or naturally open water (wetlands and lakes without ice).
Figure 7. Flowchart showing the proportions of marked IP trumpeter swans from each capture state or province and where they moved to overwinter (through December 2020) and whether they settled on rivers, artificial open water (lakes with aerators, quarries, or gravel ponds), or naturally open water (wetlands and lakes without ice).
Figure 8. An overview of GPS telemetry data received from all collared IP trumpeter swans. Each line represents the period of data collection from a single collared swan. The grey regions indicate periods of collar deployment. The black lines are 1 January of each year. Number of deployments (including redeployments) by state/province are: Michigan (n=14), Minnesota (n=56), Manitoba (n=11), Iowa (n=12), Ohio (n=20), Wisconsin (n=9), and Arkansas (n=4).
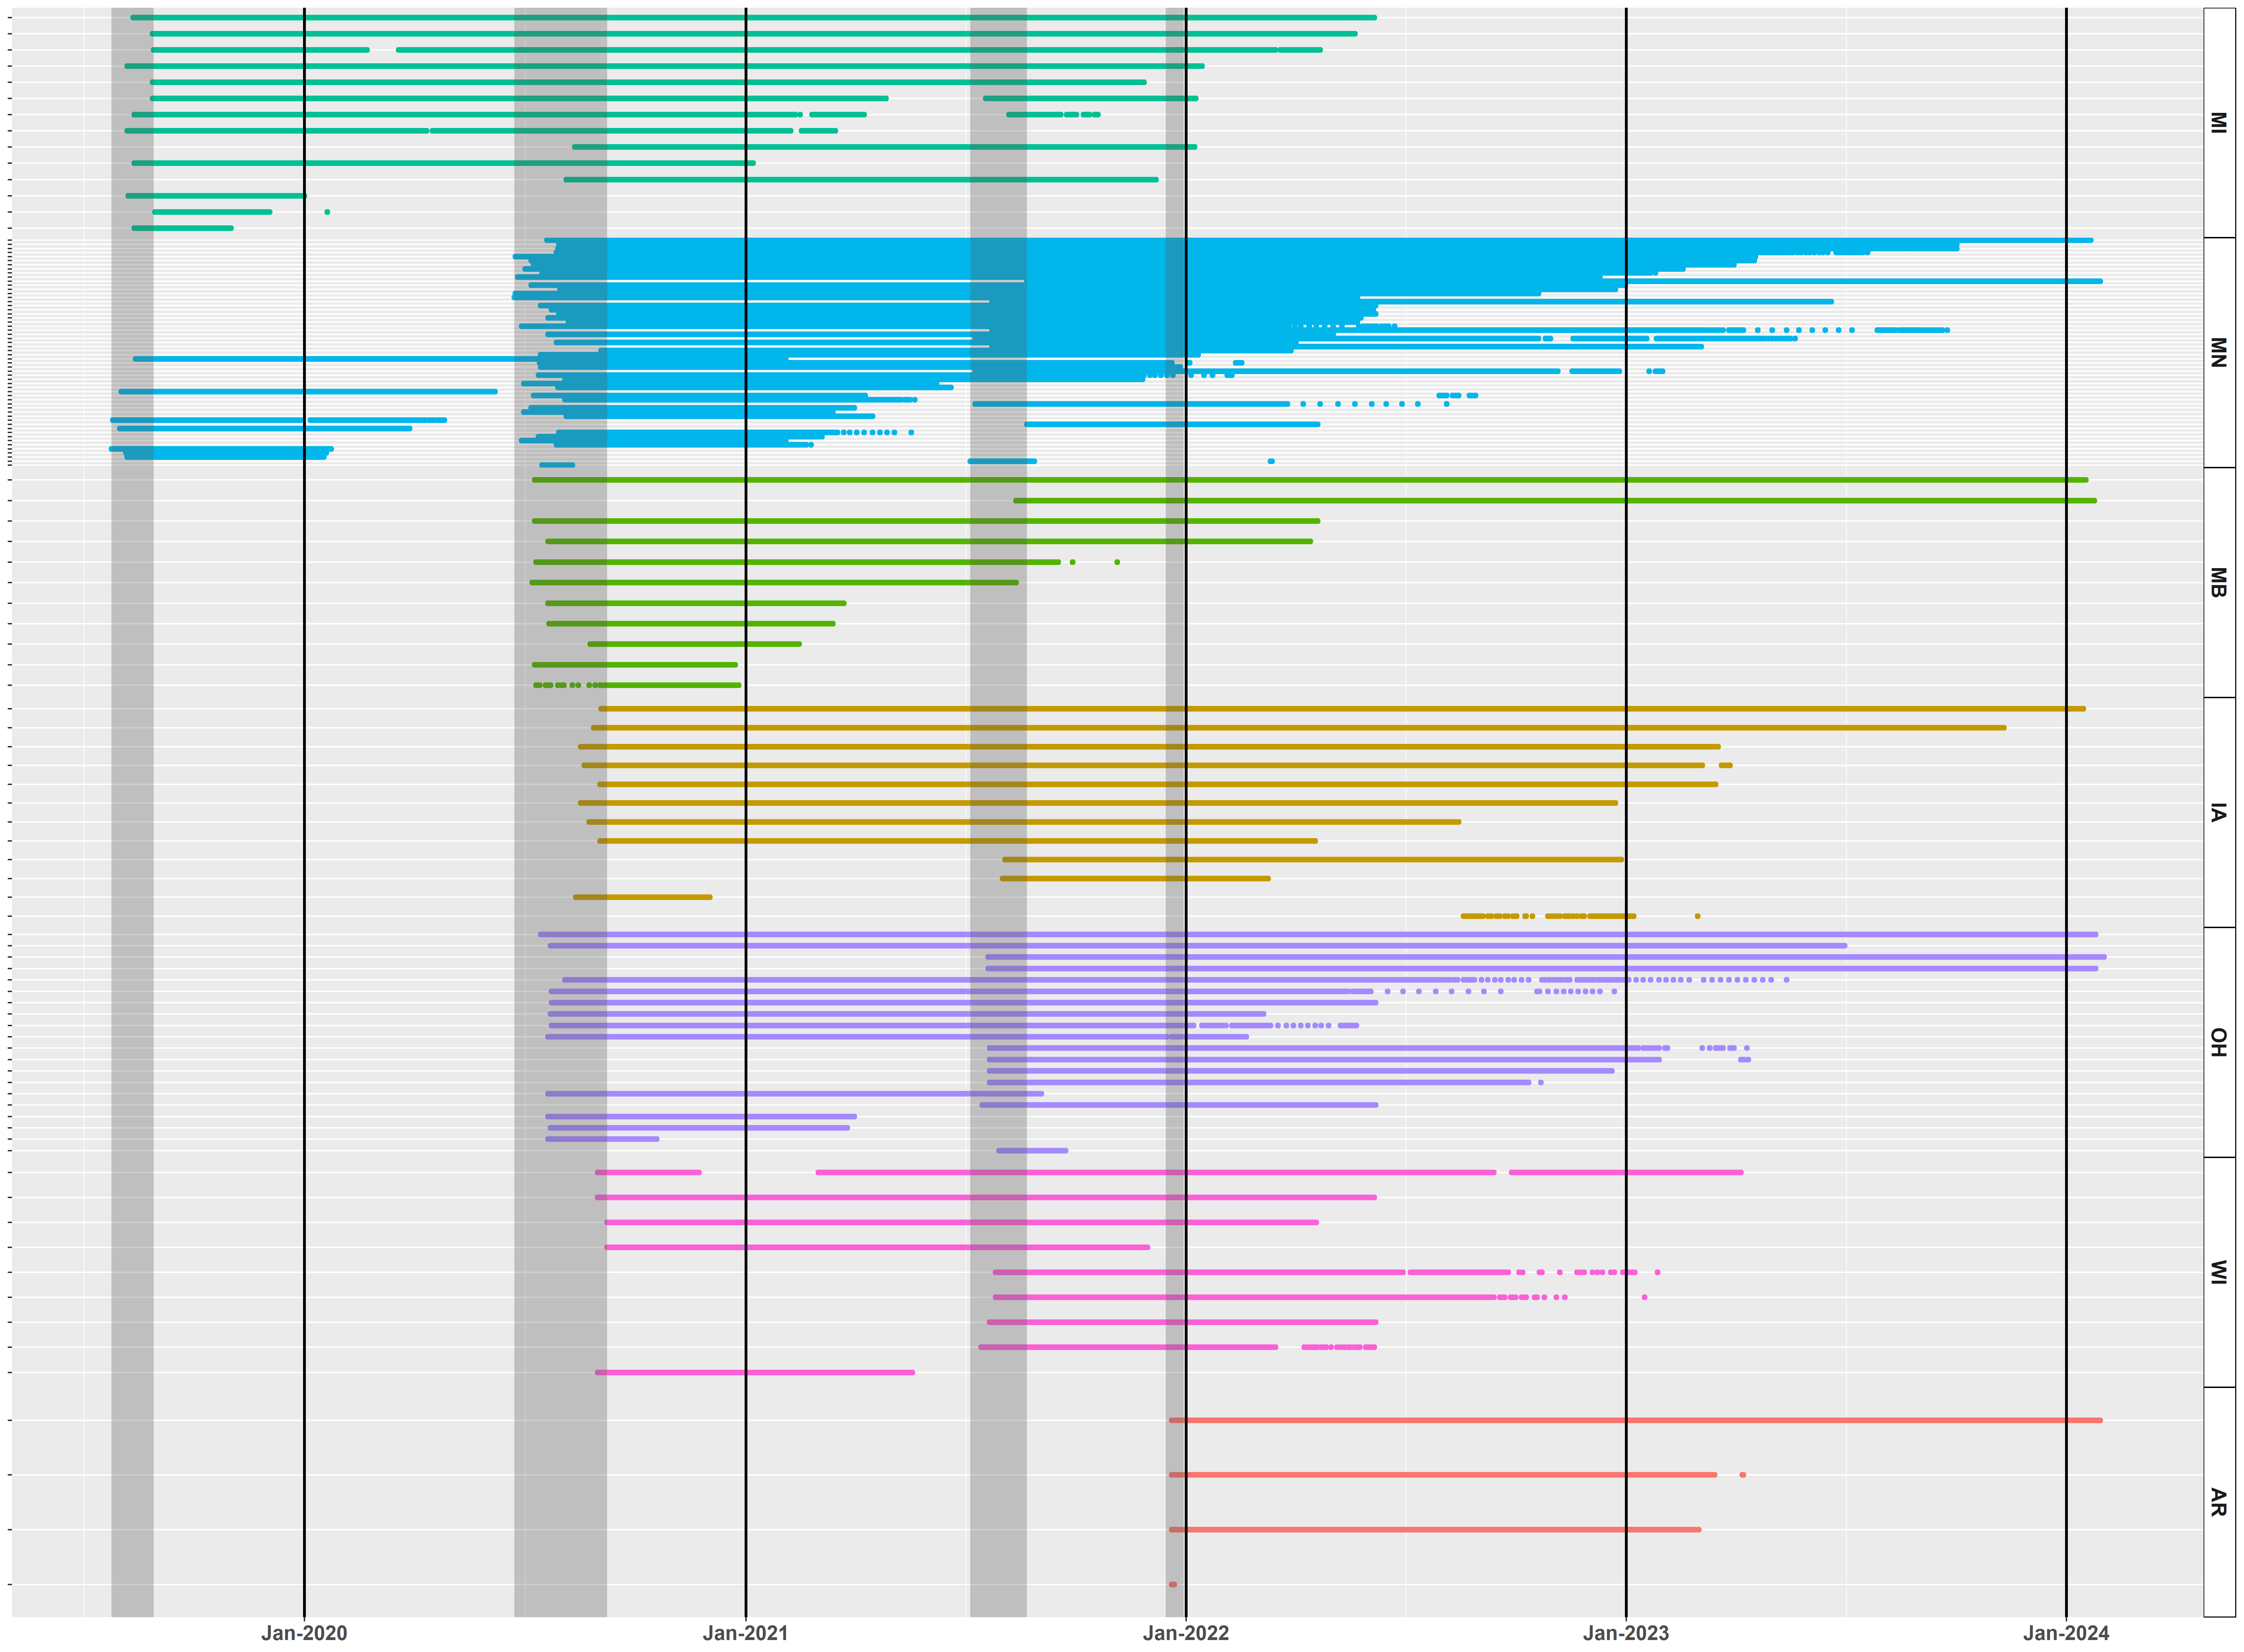
Figure 9. The relationship between the breeding (or capture) latitude of marked IP trumpeter swans and the farthest distance south moved during the non-breeding period in the 2020–2021 and 2021–2022 migration cycles.
Figure 10. Timing of the onset of IP trumpeter swan autumn departure (defined as the date during July–December when a swan first leaves its breeding/summer territory and subsequently moves >100 km away during the non-breeding period). Swans were considered breeders if cygnets were present at the time of capture, paired if a mate was present but cygnets were not observed, and non-breeders if the swan was alone or in a large group of unpaired swans.
Figure 11. Timing of IP trumpeter swan spring arrival dates (defined as the date during December–July when the swan returns within 10 km of the summer/breeding territory from the previous year, after having moved >100 km from the breeding/summer territory during the non-breeding period). Swans were considered breeders if cygnets were present at the time of capture, paired if a mate was present but cygnets were not observed, and non-breeders if the swan was alone or in a large group of unpaired swans.
Figure 12. Duration of IP trumpeter swan migration (defined as the difference in time between onset of autumn departure and spring arrival, with all previously described rules defining autumn and spring migration). Swans were considered breeders if cygnets were present at the time of capture, paired if a mate was present but cygnets were not observed, and non-breeders if the swan was alone or in a large group of unpaired swans.
Figure 13. Model coefficient estimates and 95% confidence intervals for a linear mixed model of spring arrival and linear models of autumn departure and migration duration (defined as the number of days away from the breeding/capture territory). The covariate for sex represents the difference between males and females (the reference category). The coefficients for non-breeder and paired contrast these categories with breeders (the reference category). Blue results represent positive coefficient estimates and red results represent negative coefficient estimates.
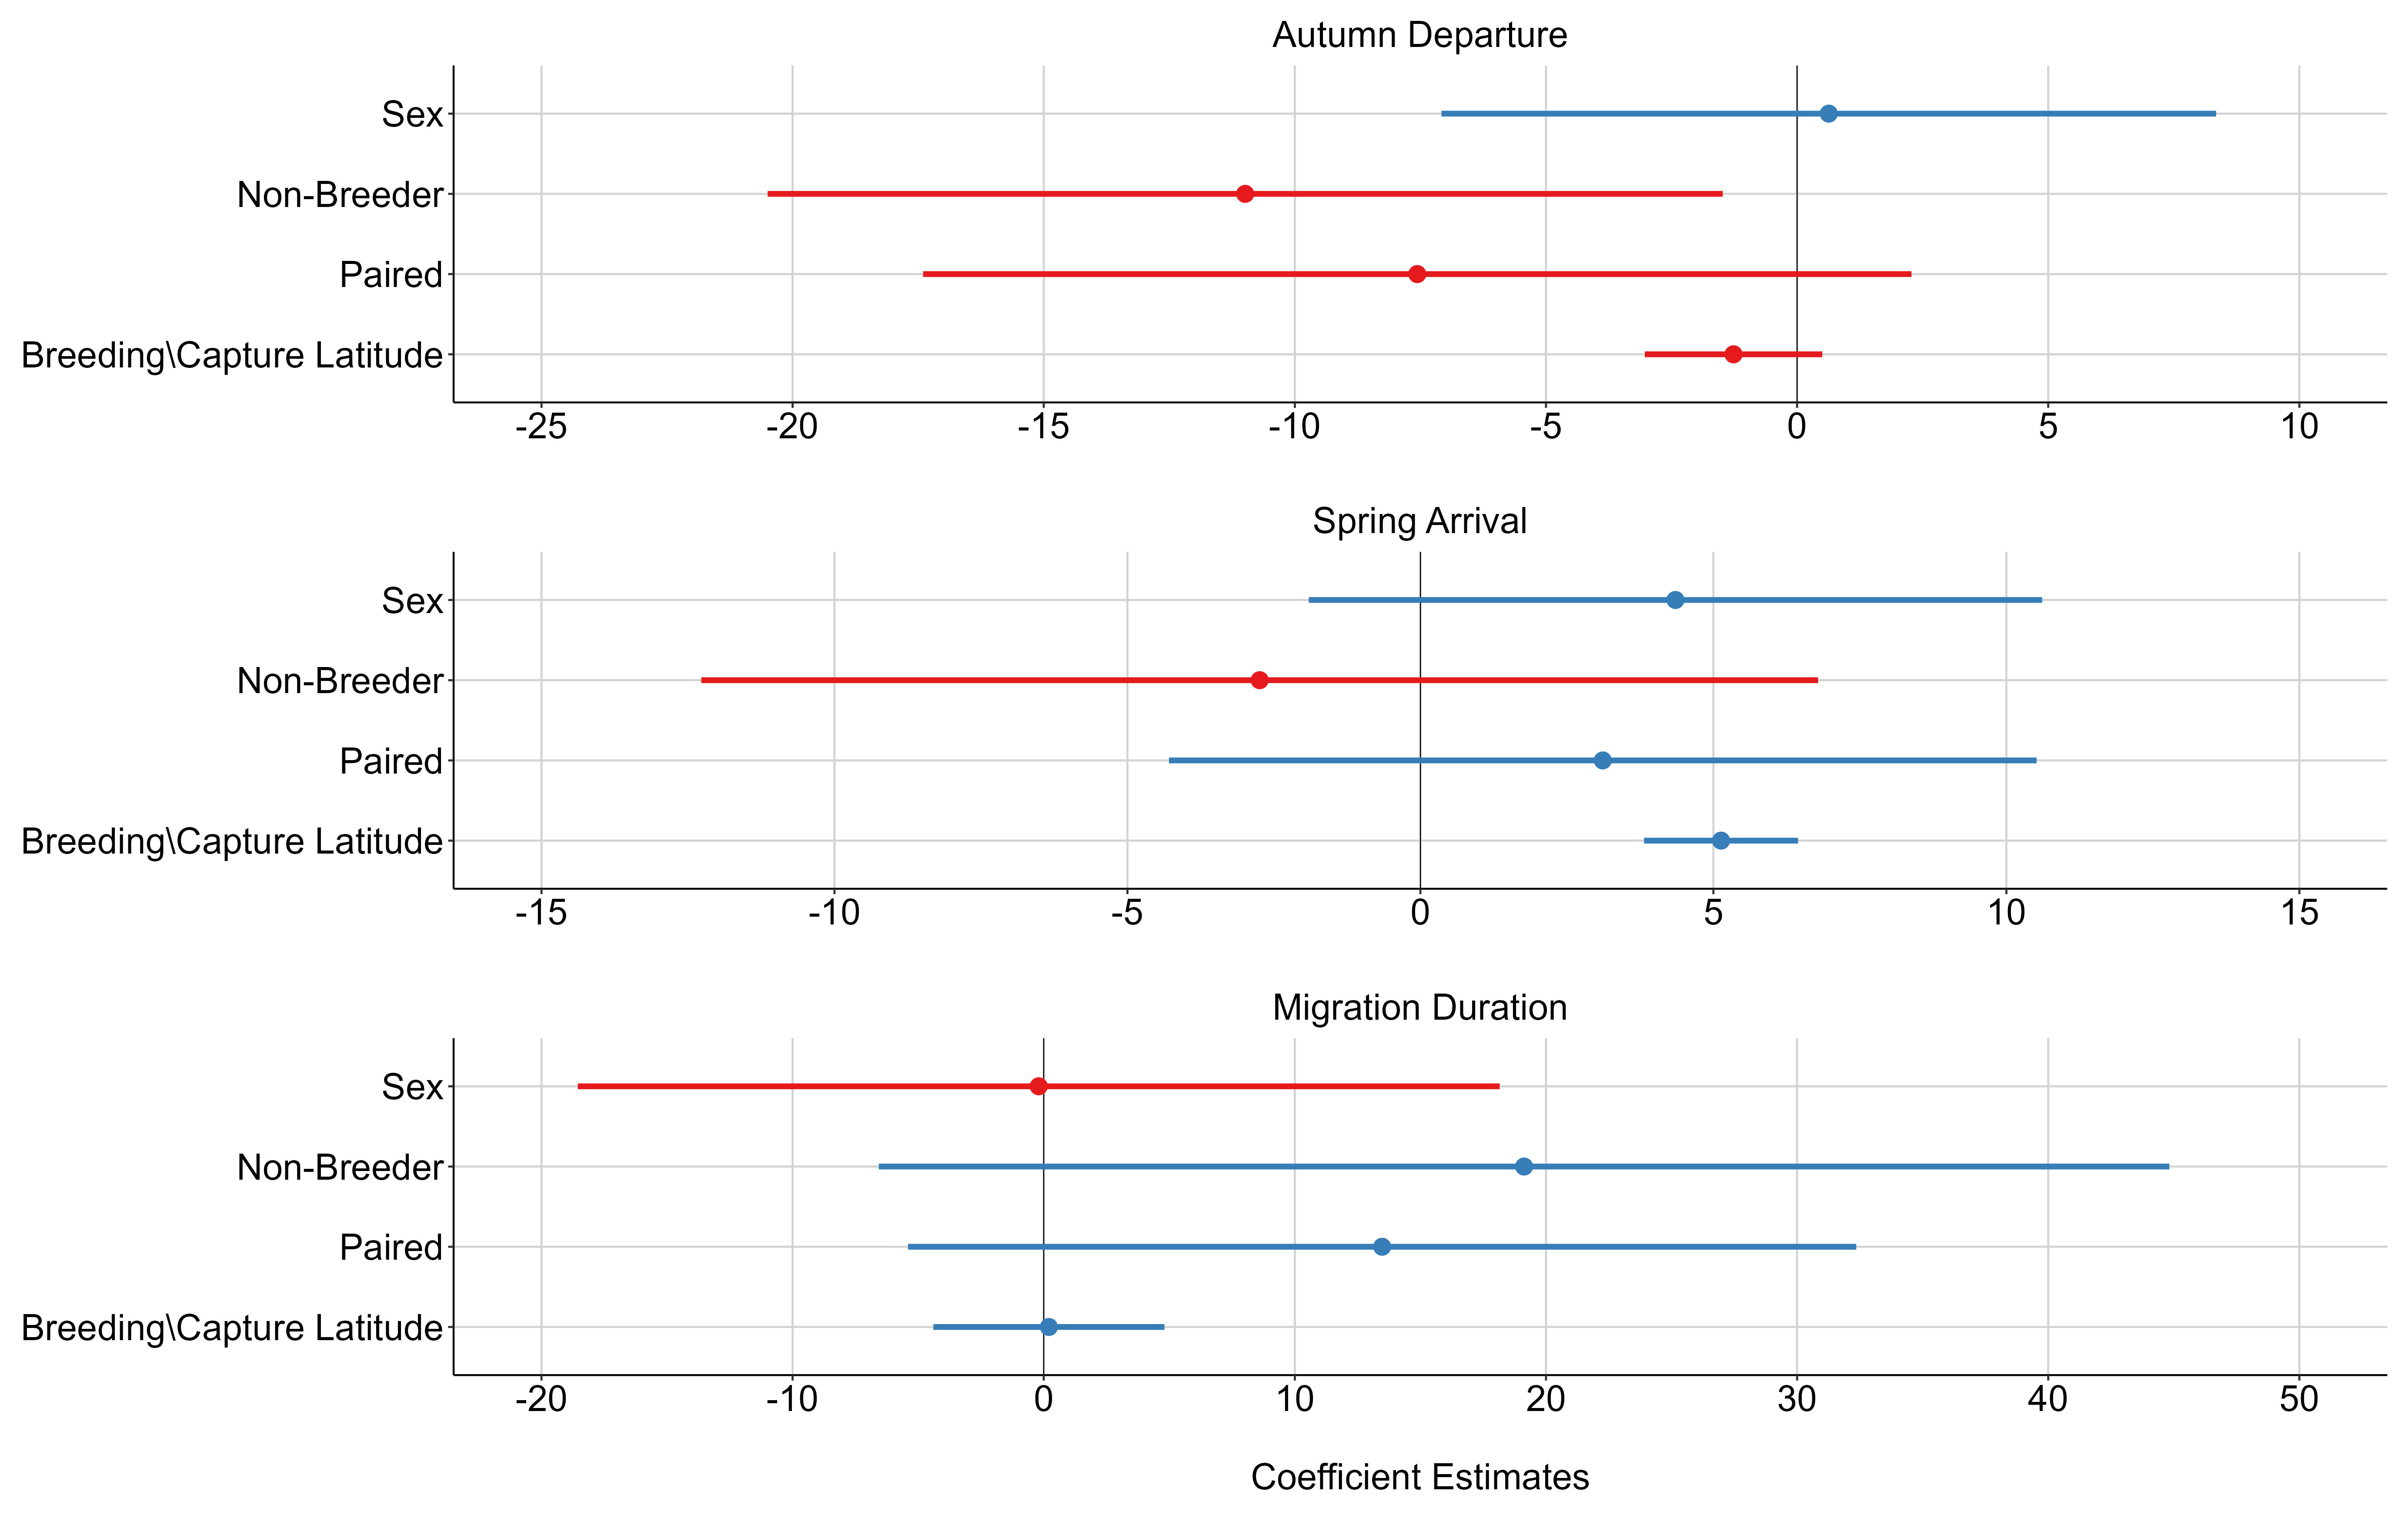
Figure 14. Clustering results from single-nucleotide polymorphism (SNP) sequencing data. Principal components analysis (PCA), which separates groups based on the overall total variance in nucleotide sequences, is plotted on the right with the first two principal components as the axes. Discriminant analysis of principal components (DAPC), shown on the left, differs from PCA in that it maximizes the separation between groups while minimizing the variation within groups.
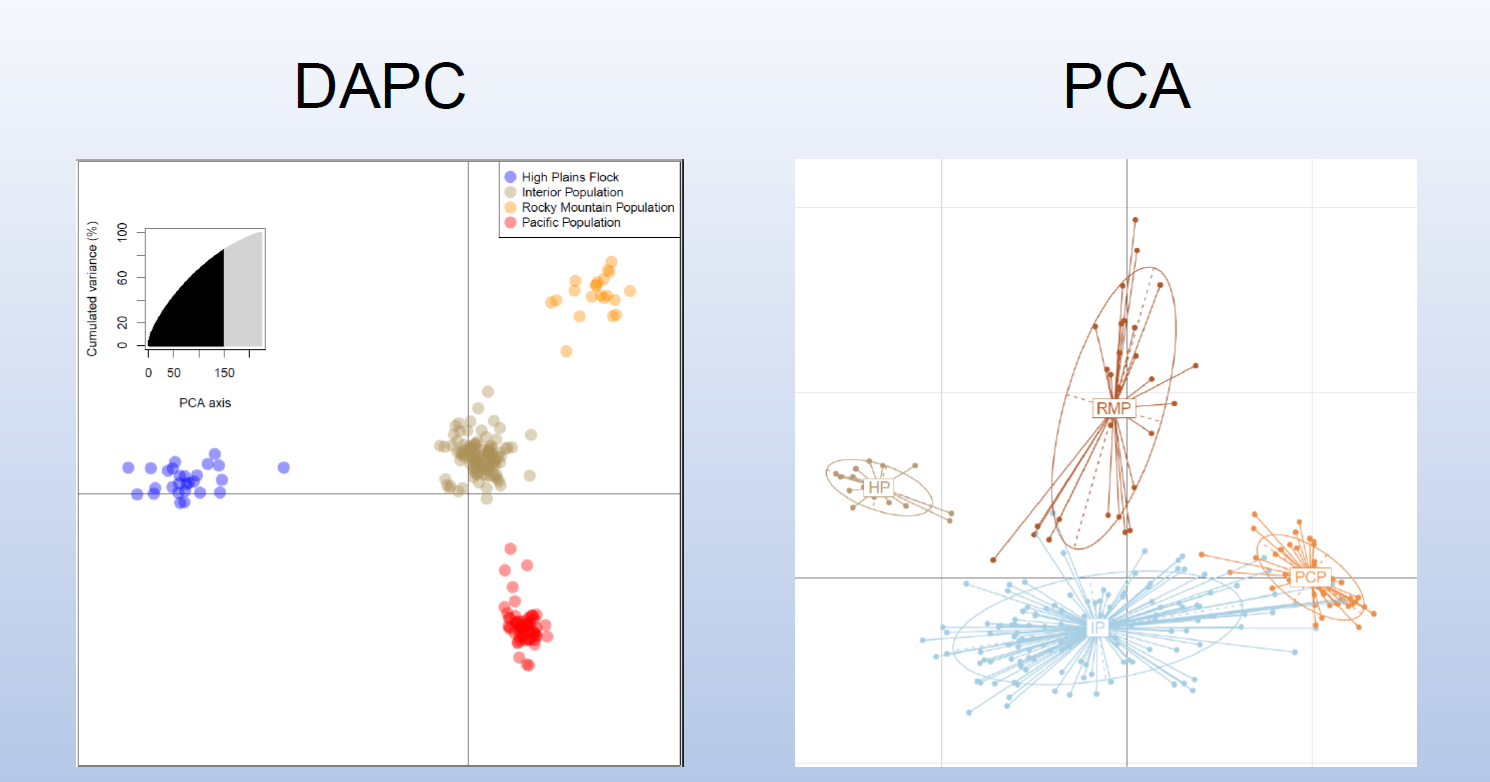
Table 1 Model coefficients, lower and upper 95% confidence intervals (CI), and t- and p-values associated with hypothesis tests for coefficients describing the relationship of trumpeter swan blood lead concentration (in parts per billion) to distance moved in kilometers from capture location to the farthest point south during autumn migration in 2020.
| Estimate | Lower 95% CI | Upper 95% CI | t value | p value | |
|---|---|---|---|---|---|
| (Intercept) | 131.05 | -12.88 | 274.97 | 1.82 | 0.07 |
| lead_ppb | 0.35 | -0.56 | 1.26 | 0.77 | 0.44 |
Table 2. Summary statistics of each category of IP trumpeter swans separated by their overall displacement from the breeding/summer territory throughout the year (resident < 20 km ; local short distance < 100 km; regional medium distance < 300 km; long-distance > 300 km). We did not consider resident or local migrants to have undergone ‘typical’ migration, and therefore did not estimate a spring arrival date for those individuals.
| Migration category | Year | Number in category | Average first departure | Average spring arrival |
|---|---|---|---|---|
| long-distance | 2020 | 40 | November-03 | March-05 |
| long-distance | 2021 | 26 | October-23 | March-09 |
| regional | 2020 | 9 | October-31 | March-02 |
| regional | 2021 | 14 | October-18 | February-26 |
| local | 2020 | 11 | September-07 | NA |
| local | 2021 | 16 | September-14 | NA |
| resident | 2020 | 14 | September-23 | NA |
| resident | 2021 | 11 | October-14 | NA |